On the face of it, August 2026 was the month the grid finally got a break.
India's peak demand came in at 258,276 MW, almost twelve gigawatts below July's 270,209 MW. The load factor, which had fallen off a shelf in July, climbed back from 83.96% to 87.34%. Energy shortage stayed at a whisker: 203 MU on 168,032 MU of demand, or 0.12%. Read the monthly summary and you would conclude the rains showed up, the north cooled off, and everyone exhaled.
Then you look at the daily numbers.
The average daily peak across July was 243,456 MW. Across August it was 243,503 MW. Forty-seven megawatts apart, on a quarter-terawatt system, which is to say identical. August didn't use less power and it wasn't a softer month. It simply never managed to want everything at the same moment.
That's the whole story, and it runs through every other number on the page. August's 12 GW of apparent relief is not a demand effect. It is a coincidence effect.
The twelve gigawatts that weren't
The headline comparison is real enough. CEA has August peak met at 258,270 MW against July's 270,203 MW, and against 229,715 MW in August 2025. Year on year that is growth of 12.4% on peak and 12.2% on energy, which is the kind of lockstep you would expect from a normally behaved system and did not get at all in July.
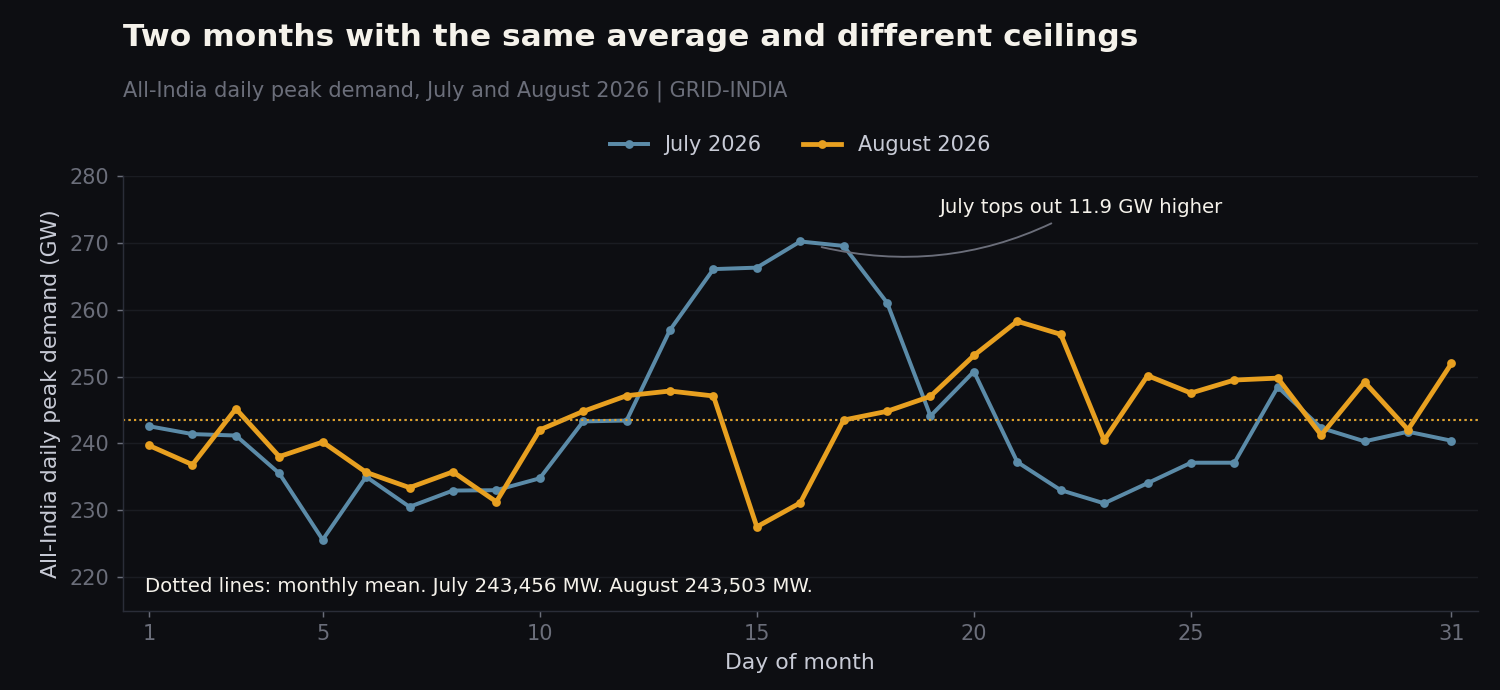 Daily peak demand for both months on one axis. The dotted lines are the monthly means, and they sit on top of each other. Source: GRID-INDIA daily demand, via the Wattfeed dashboard.
Look at the two lines and the shape of the difference is obvious. July has a mountain in the middle, four days between the 14th and the 17th where the country went to 266 GW and above. August has no mountain. It has a long ridge: a month that sat in the mid-240s and poked above 250 GW on five separate days without ever stacking them together.
The month's highest moment, 258,270 MW, landed on 21 August. Its quietest day still managed 227,534 MW, which would have been a national record as recently as 2024. Thirty of the thirty-one days in August 2026 came in above the single best day of August 2025.
On that peak day the curve topped out at 15:50 and bottomed at 04:05, a swing of 38,650 MW. That is marginally gentler than July's 41,279 MW and still enormous. The afternoon is where the grid lives now, and August did nothing to change that.
The average day didn't move
Here is the cleanest way to see it. Take the thirty-one daily peaks in each month, sort them from highest to lowest, and put the curves on the same chart.
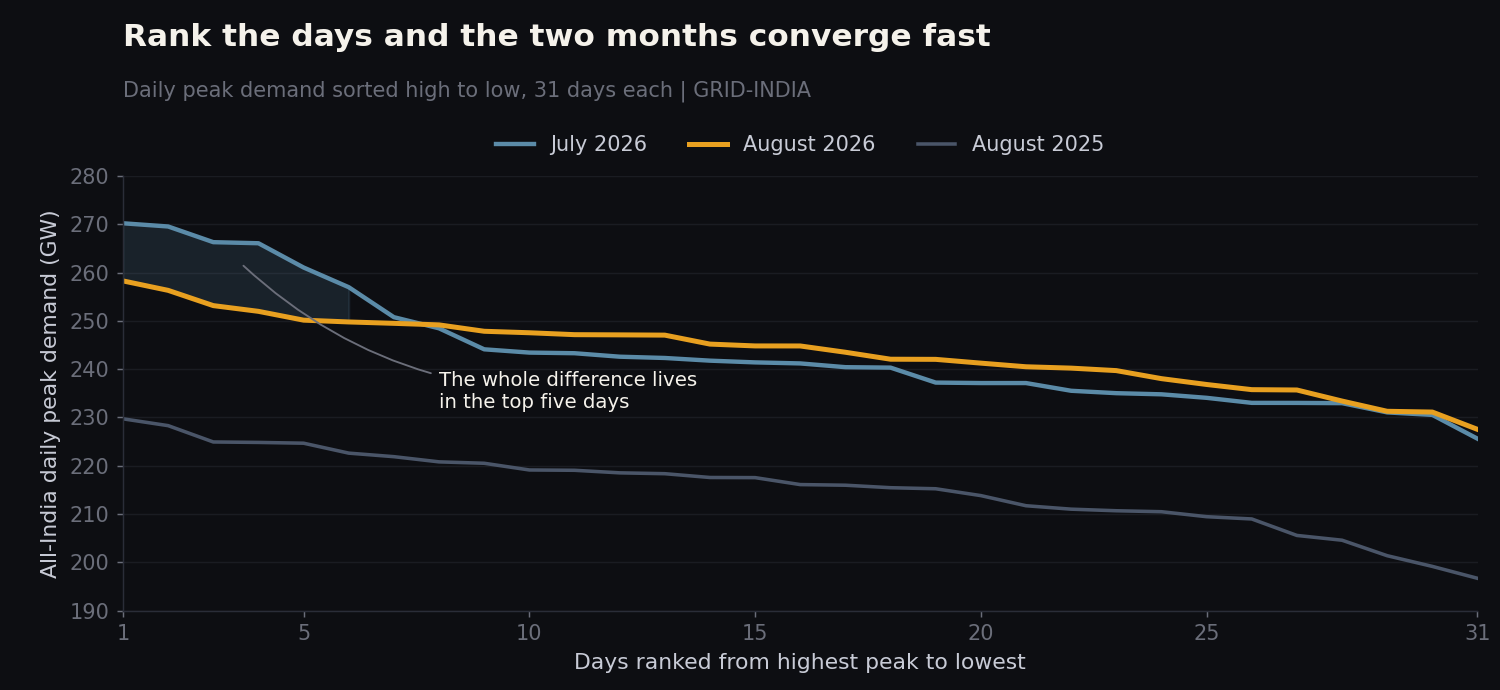 Each month's 31 daily peaks, ranked. The gap between July and August closes by the seventh day and then reverses. Source: GRID-INDIA daily demand, via the Wattfeed dashboard.
July's top five days averaged 12.66 GW above August's top five. From day six onwards, August ran 2.49 GW higher than July. The entire twelve-gigawatt headline difference between the two months is produced by five days, and once you step past them August is the busier month of the two.
This matters for anyone who plans capacity off a monthly peak number. The monthly peak is a measurement of one instant. It told you July was a 270 GW month and August a 258 GW month. The thirty-one-day distribution tells you both months asked the grid for almost exactly the same thing, and one of them happened to ask on a worse afternoon.
The energy side agrees, and never wavered.
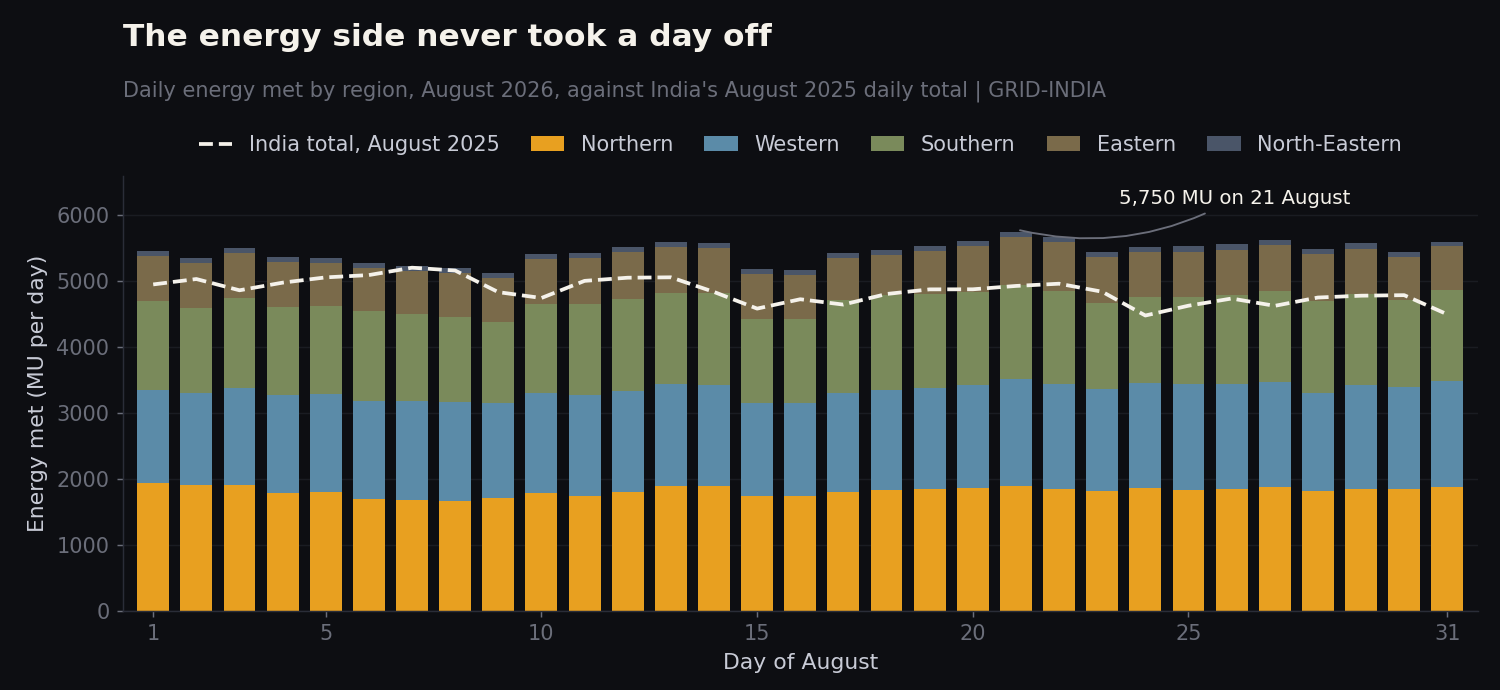 Daily energy met by region, August 2026, against India's August 2025 daily total. Source: GRID-INDIA daily demand, via the Wattfeed dashboard.
August delivered 169,095 MU across the month on the daily series, against 150,468 MU a year earlier, and twenty-seven of the thirty-one days cleared the highest single day of August 2025. The biggest, 21 August, moved 5,750 MU. There is no day in that chart you could point to and call quiet.
Energy went up 12.2%. Peak went up 12.4%. The load factor barely twitched, 87.34% against 87.63%. For one month, the two halves of the system grew at the same speed again.
The regions stopped doing it together
So where did the twelve gigawatts actually go? Not out of any region's demand. Every single region peaked higher in August 2026 than in August 2025: Eastern up 13.2%, Southern 11.0%, North-Eastern 9.8%, Western 9.0%, Northern 8.1%.
They just did it on different days.
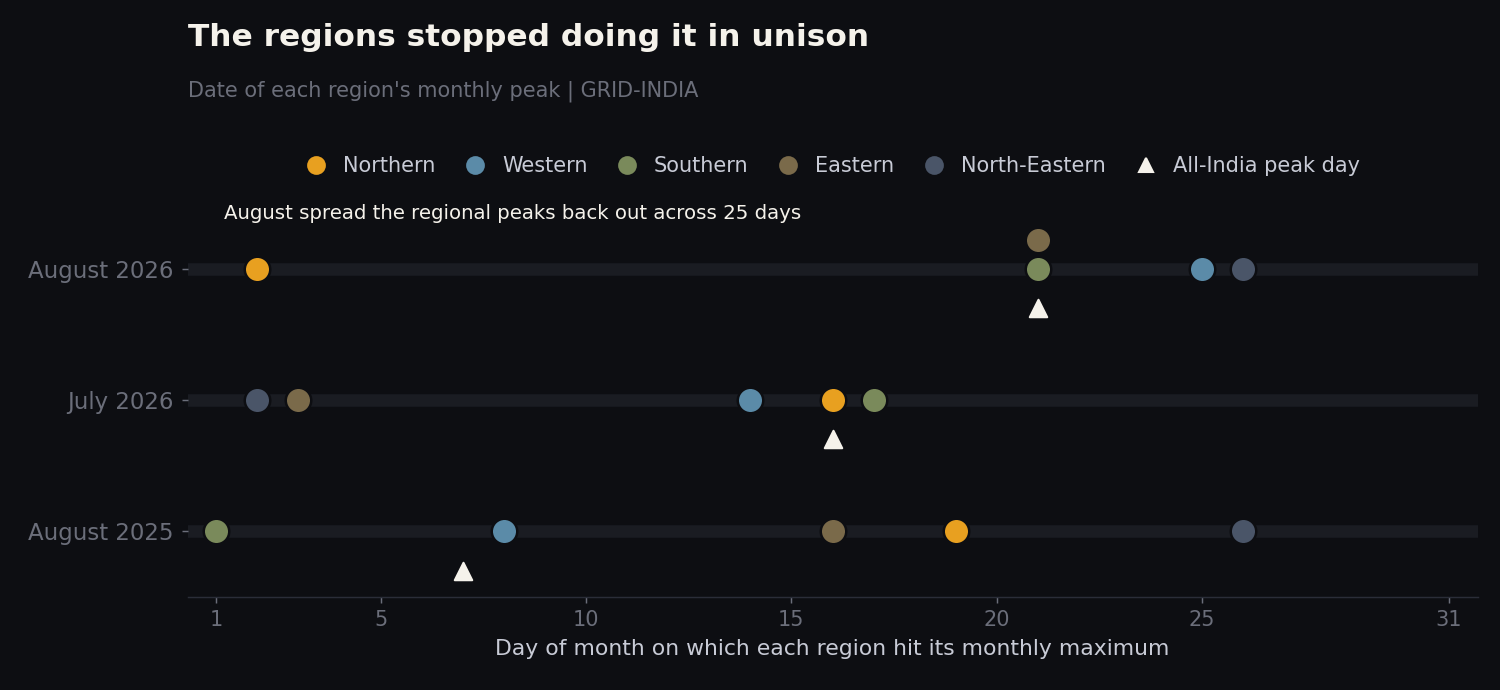 The calendar day each region recorded its monthly maximum. Source: GRID-INDIA daily demand, via the Wattfeed dashboard.
In July, Western, Northern and Southern all hit their monthly highs between the 14th and the 17th, and the national peak went up like a stack of dominoes falling the same way. In August the regional maxima are scattered across twenty-five days: Northern on the 2nd, Southern and Eastern on the 21st, Western on the 25th, North-Eastern on the 26th.
Sum the five regional maxima and divide by the national peak and you get the monthly diversity factor. July 2026: 1.035, which is about as synchronised as a country this size gets. August 2026: 1.053. August 2025, for reference, was 1.089.
The regional detail is worth a beat, because it inverted. Northern region came off 8.2% from its July peak, which is the monsoon doing its traditional job on the plains. Eastern went the other way and added 9.5% on top of July, after being the only region to shrink year on year in July. The east spent July sulking and spent August making up for it.
Diversity is the grid's quietest asset. Nobody builds it, nobody bills for it, and in August it was worth about twelve gigawatts of peak.
What the monsoon is actually worth now
Which brings us to the thing everyone assumes about Indian demand and should probably stop assuming.
The monsoon is supposed to take the top off the year. Measure that properly: average the July and August peaks, and see how far that sits below the same year's April-to-June high. That's the monsoon's dent, and it has been shrinking.
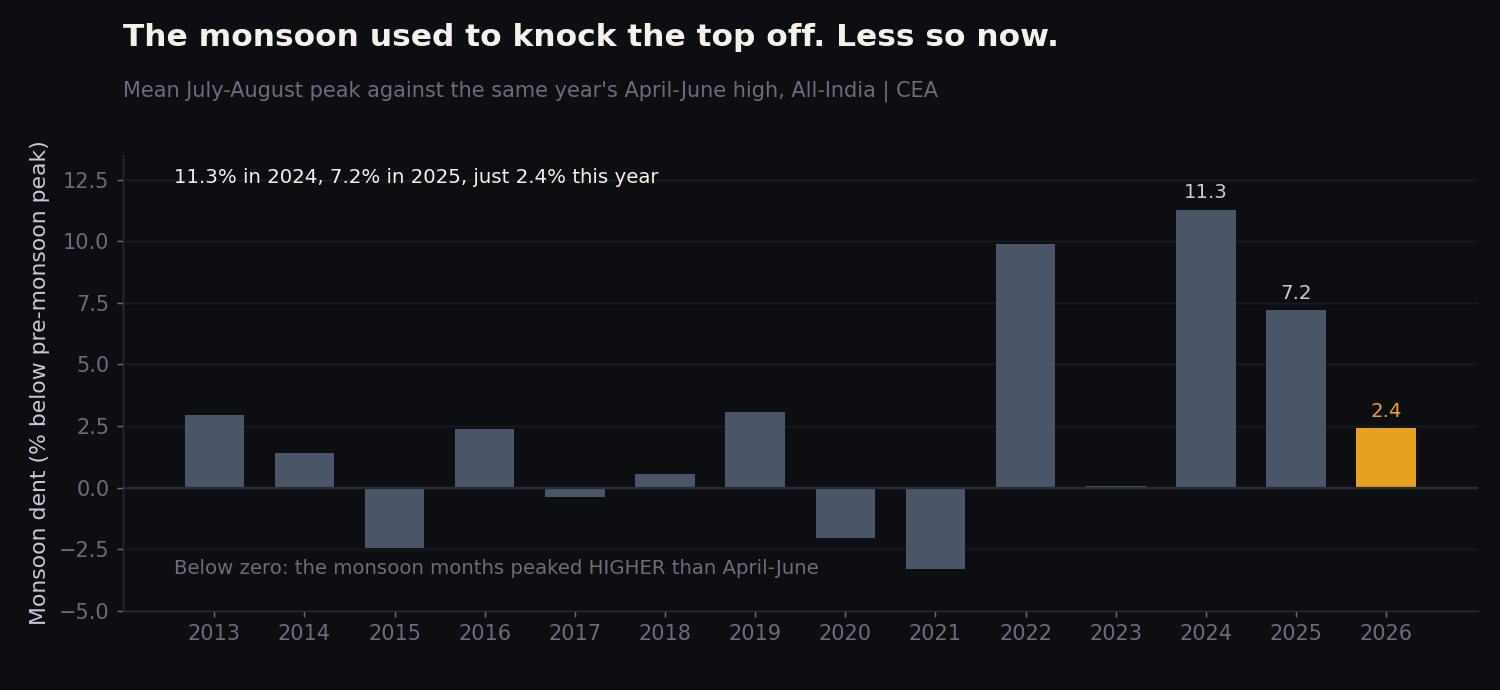 Mean July-August peak as a shortfall against the same year's April-June maximum. Negative bars are years when the monsoon months peaked higher than the pre-monsoon ones. Source: CEA, via the Wattfeed dashboard.
In 2024 the dent was 11.3%. In 2025, 7.2%. This year it is 2.4%, which means the two wettest months of 2026 came in within a hair of the pre-monsoon high.
The longer view is more interesting than either number. Across the whole fourteen-year series the dent has never been large. It averaged a quarter of a percentage point from 2013 to 2021, and in four of those nine years it was negative, meaning July and August out-peaked April to June outright. The genuinely unusual years are the recent ones: 2022, 2024 and 2025, when the monsoon months fell seven to eleven per cent short.
So this year hasn't broken a rule. It has gone back to the older one, at a much higher level. The reliable monsoon discount of the last few summers was the anomaly, not the baseline, and planning that assumes the rains will reliably hand back ten per cent of the peak is planning against three years of data rather than fourteen.
August did take the top off, by 4.4% against July. It just took it off by rearranging the calendar rather than by cooling the country down.
Where the growth actually is
Underneath the national numbers, August was not remotely uniform. Six states carried most of it.
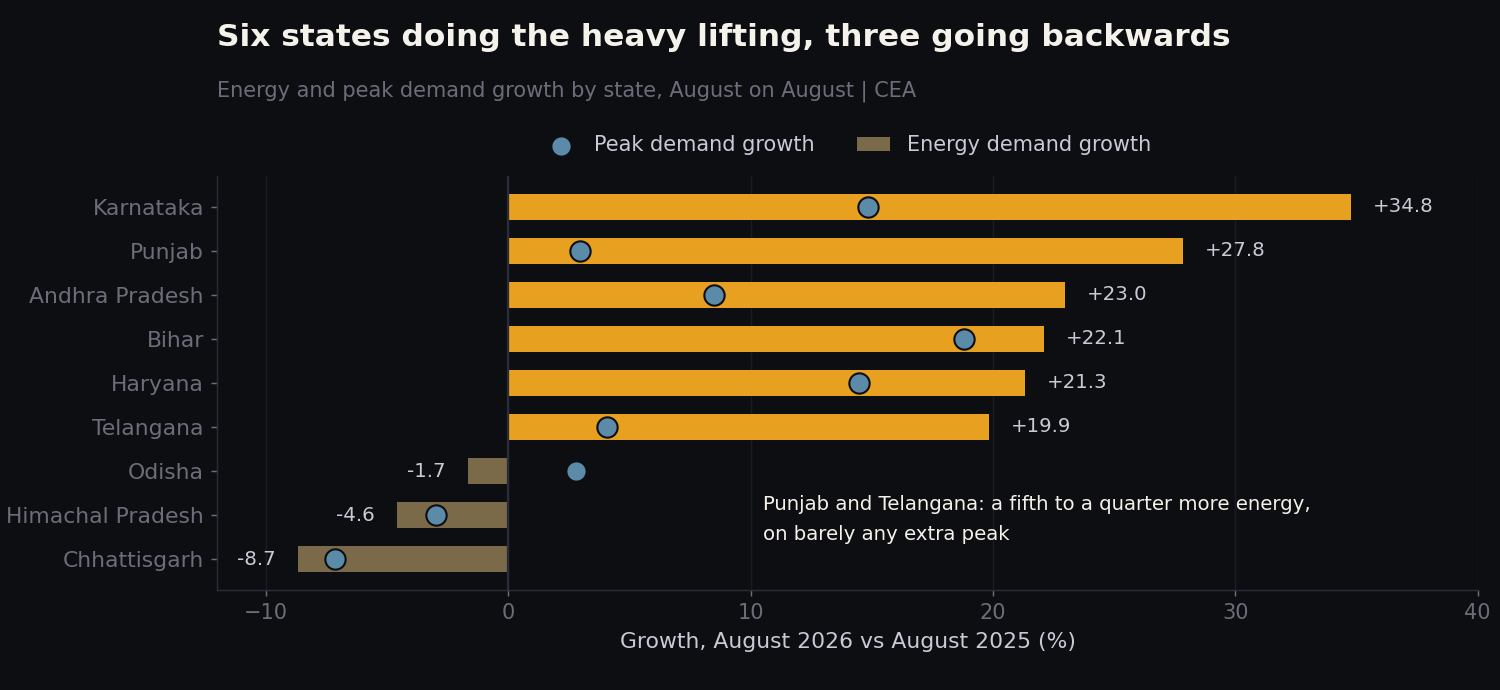 The six fastest and three slowest states by energy demand growth, with each state's peak demand growth marked separately. Source: CEA, via the Wattfeed dashboard.
Karnataka added 34.8% more energy than it did in August 2025, on peak growth of 14.9%. Punjab added 27.8% on peak growth of 3.0%. Andhra Pradesh 23.0%, Bihar 22.1%, Haryana 21.3%, Telangana 19.9%.
Punjab and Telangana are the pair worth staring at. Both added a fifth to a quarter more energy while their peaks went almost nowhere, 3.0% and 4.1%. That is load arriving flat and staying flat: more hours at a similar height rather than a higher spike, which is what pumping and industrial shift work look like in a monthly aggregate. It is also, from a system point of view, the single most welcome kind of growth there is, because it fills the valleys rather than raising the ceiling.
Bihar is the opposite and just as encouraging in its own way: 22.1% more energy on 18.8% more peak, growth that is simply growth, arriving in proportion. Bihar's August peak crossed 9,591 MW, up from 8,073 MW a year ago.
And three states went backwards. Chhattisgarh fell 8.7% on energy and 7.2% on peak. Himachal Pradesh dropped 4.6%. Odisha slipped 1.7% on energy while its peak edged up 2.8%. In a month when the country added over twelve per cent, three states shrinking is not noise, and Chhattisgarh's scale of decline in a heavily industrial state is the kind of thing that usually has a specific cause behind it.
Shortage, meanwhile, stayed trivial almost everywhere. The national figure of 203 MU was concentrated in Punjab (54 MU, 0.51% of its demand) and West Bengal (49 MU, 0.65%). Across FY 2026-27 so far, April to August, India has seen 1,090 MU of shortage against 819,127 MU of demand. That ratio is the quiet triumph in all of this.
What the market made of it
The Day-Ahead Market read August the same way the daily data does: busy, not stretched.
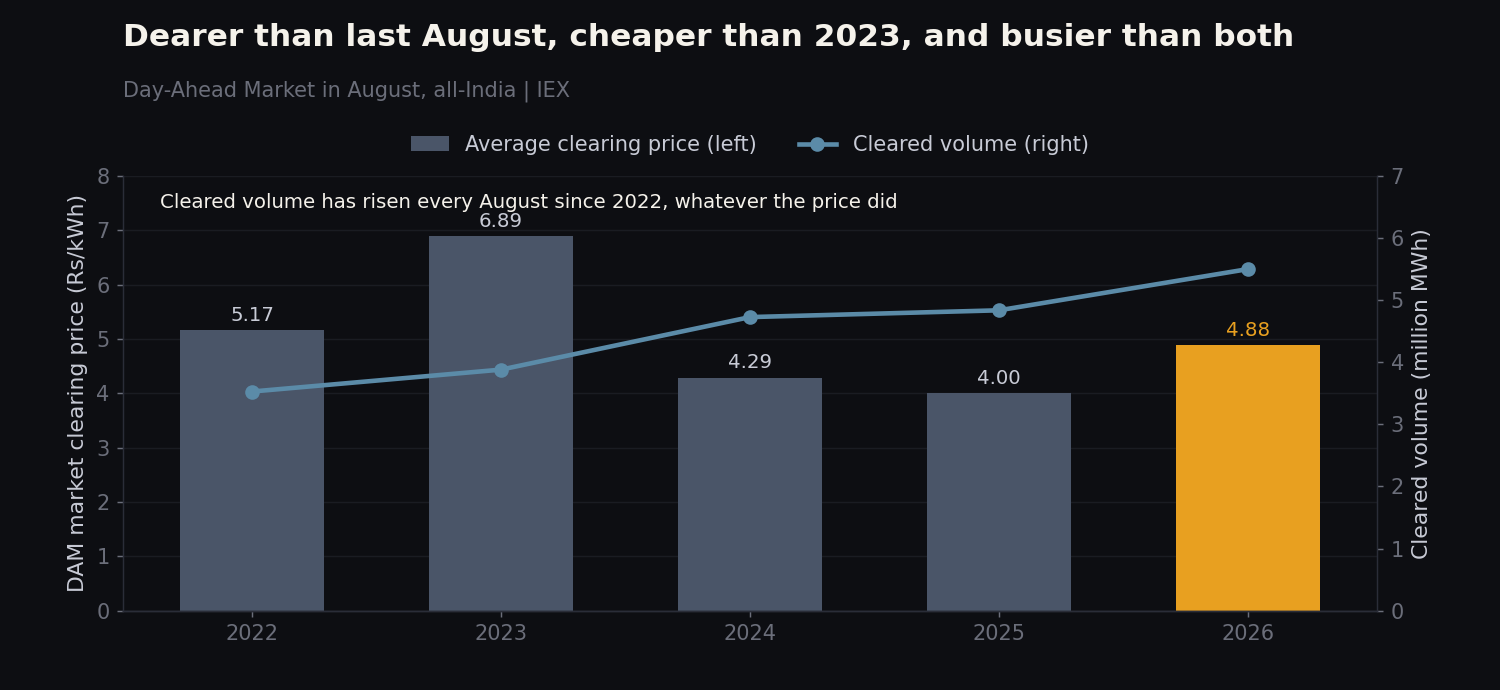 Average market clearing price and cleared volume in August, all-India. Source: IEX, via the Wattfeed dashboard.
The average clearing price in August 2026 was Rs 4.88 per kWh, up 22.0% on last August's Rs 4.00 but comfortably below the Rs 6.89 of August 2023. Against July 2026, at Rs 5.00, it actually eased by a little over two per cent.
Volume is the number that moved properly. Cleared volume reached 5.50 million MWh, the busiest August in the series and 13.7% above last year. Purchase bids ran to 12.93 million MWh against 8.00 million a year earlier, a jump of nearly 62%. More buyers, more cleared, at a price that is well short of the tight years. That is a market absorbing a much larger system rather than one straining against it.
The shape of the day is where it gets genuinely interesting, and it's the one chart neither page can make on its own.
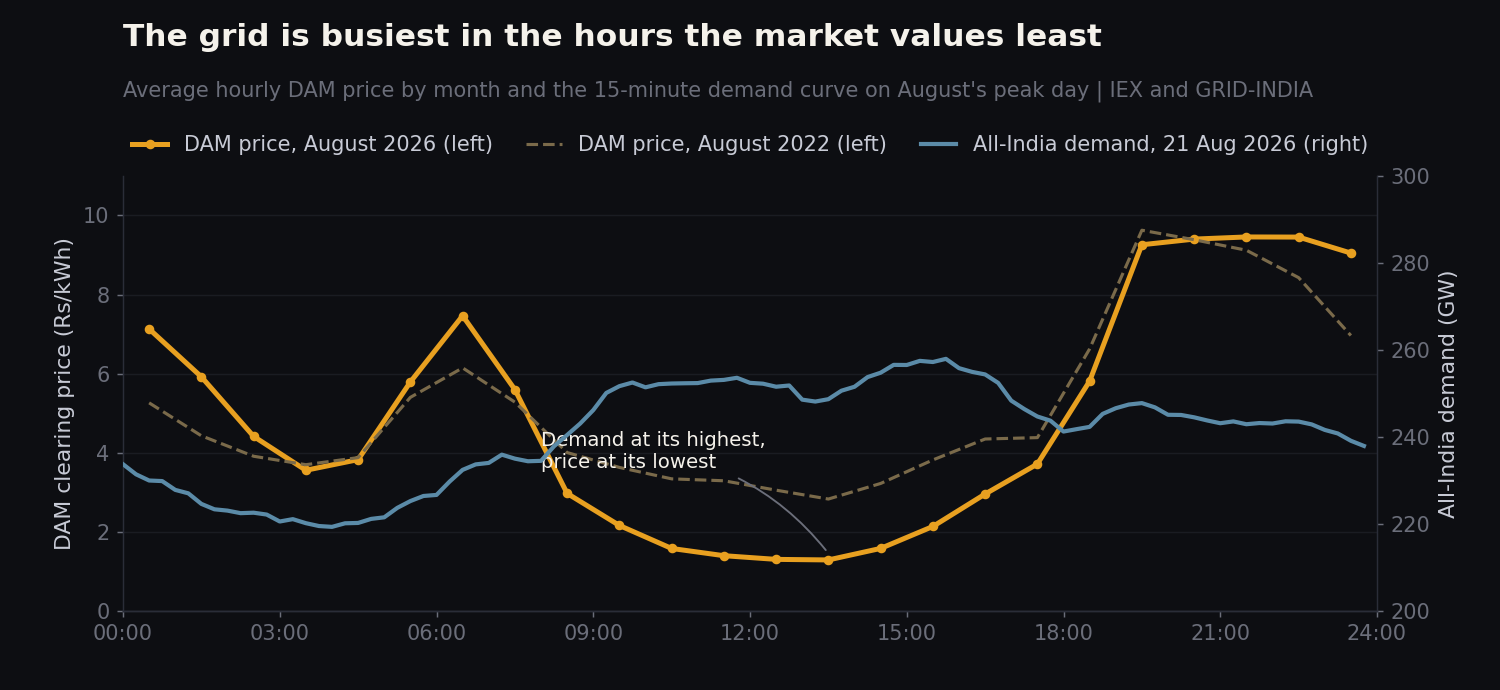 Average hourly DAM clearing price for August 2026 and August 2022, plotted against the 15-minute all-India demand curve on 21 August 2026, the month's highest-demand day. Sources: IEX for prices, GRID-INDIA load curves for demand, both via the Wattfeed dashboard.
The demand curve peaks mid-afternoon. The price curve bottoms out at exactly the same time, Rs 1.28 per kWh in the 13:00 hour, and then rockets to Rs 9.46 by 21:00, long after demand has come off its high. Whatever is filling the middle of the day is doing it very cheaply indeed, and the market is paying a premium of more than seven rupees a unit for the hours after it stops.
That gap is widening. In August 2022 the spread between the cheapest and dearest hour was Rs 6.80 per kWh. In August 2026 it is Rs 8.17. The grid's busiest hours and the market's dearest hours have been pulling apart for four years, and August 2026 is the widest they have been.
A system with a flat afternoon and a cliff at seven in the evening is a storage problem wearing a pricing costume.
What happens next
- The monsoon dent will probably stay small. Fourteen years of data put it under 2% on average, and 2024 and 2025 look like the exceptions rather than the rule. If 2027 behaves like the long run rather than the last three years, expect July and August peaks within a few per cent of the pre-monsoon high again, rather than the ten per cent discount recent planning has been able to lean on.
- Diversity is the variable to watch, not the peak. July ran at 1.035 and August at 1.053, and the twelve-gigawatt swing between them came entirely from that. Two or three more synchronised months like July would make the national peak look like it is growing far faster than any region actually is, which is a measurement artefact that could easily be read as a capacity emergency.
- The next all-India record will be set between April and June 2027, and should clear 285 GW. May 2026 reached 270,832 MW. On the growth rates in this data, even a slower year puts next summer's high in the mid-to-upper 280s, and the monsoon months are unlikely to be where it lands.
- Flat-load growth is spreading. Punjab and Telangana added a fifth or more of energy on almost no extra peak this August. If that pattern holds across more states, national load factor could stabilise in the high eighties rather than continuing the slide of the last three years, which would be the first genuinely good structural news in this dataset for a while.
- The afternoon-to-evening gap on the exchange is the thing to keep an eye on. The spread between the cheapest and dearest hour has widened every August since 2022. The curve is pointing that way, though the grid has embarrassed forecasters before, and it is a flexibility question rather than a generation one.
Two months, the same average day, twelve gigawatts apart on paper. July got the headlines because it peaked all at once.
August did the same amount of work and had the good manners to spread it out.
All data used in this analysis can be found within the Wattfeed dashboard.