Supply-Burn Imbalance Drives Stock Drawdown
Coal consumption at India's power stations outpaced supply in May 2026, forcing a significant drawdown of on-site inventories. Power plants burnt 79.89 MT of coal while receiving only 75.58 MT, creating a national deficit of -4.31 MT. This reverses the situation from a year earlier, when the fleet registered a surplus of 3.54 MT in May 2025.
The imbalance was driven by two countervailing trends. On the demand side, coal consumption increased by +8.4% compared to the same month last year. On the supply side, total coal receipts at power plants fell by -2.2% year-on-year. The rolling twelve-month supply total was also down, showing a decline of -3.9%.
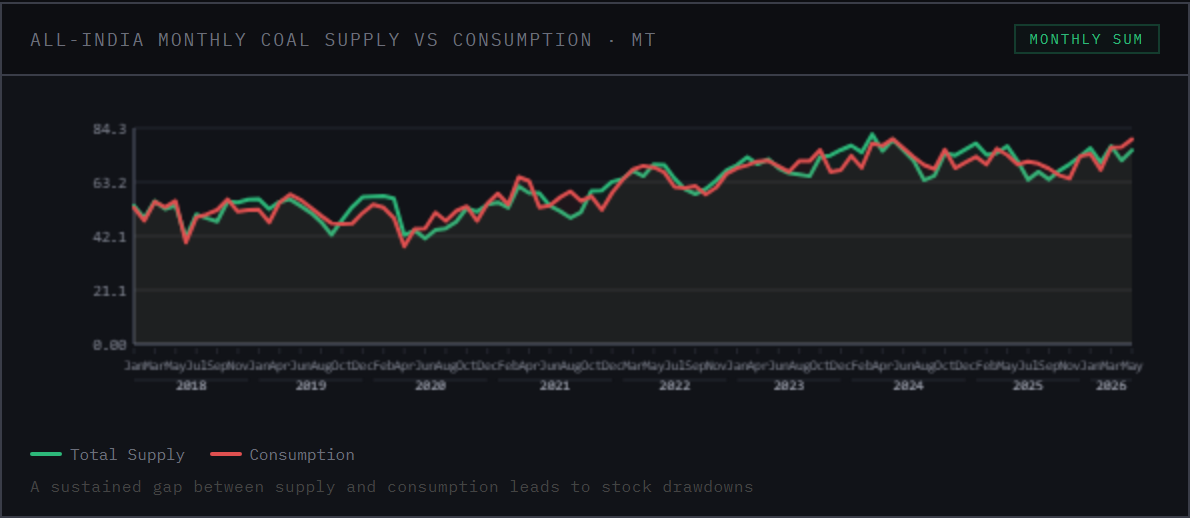 All-India monthly coal supply against consumption, in million tonnes. Source: Wattfeed dashboard.
Stocks Fall but Remain Above Seasonal Norm
The deficit in May 2026 marked the third consecutive month in which the coal fleet consumed more fuel than it received. As a result, inventories have fallen steadily. Average closing stock per plant stood at 0.219 MT/plant at the end of May, a change of -16.9% from the level seen at the end of February 2026.
Compared to the same month last year, average stocks were down -18.2% from 0.268 MT/plant in May 2025. Despite this drawdown, inventories remained in a relatively healthy position. The average stock level in May 2026 was +26.9% higher than the eight-year average for this point in the year, which is 0.173 MT/plant.
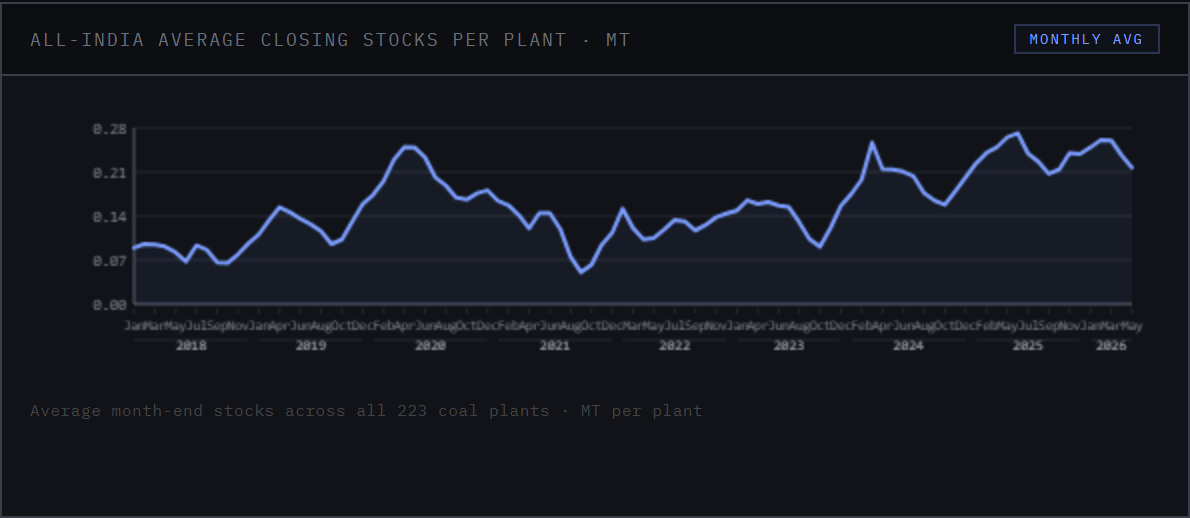 All-India average month-end closing stock per plant, in million tonnes. Source: Wattfeed dashboard.
Falling Imports Lead Weaker Supply
The year-on-year drop in total coal supply was driven primarily by a reduction in imported coal. An attribution analysis shows that of the total -1.70 MT change in supply versus May 2025, a fall in imported coal accounted for a contribution of -1.42 MT. Supply from Coal India Ltd (CIL) and Singareni Collieries Company Ltd (SCCL) also fell, contributing -0.87 MT to the change.
These decreases were partly offset by an increase in supply from captive and commercial blocks, which made a positive contribution of 0.75 MT. E-auction coal also rose slightly.
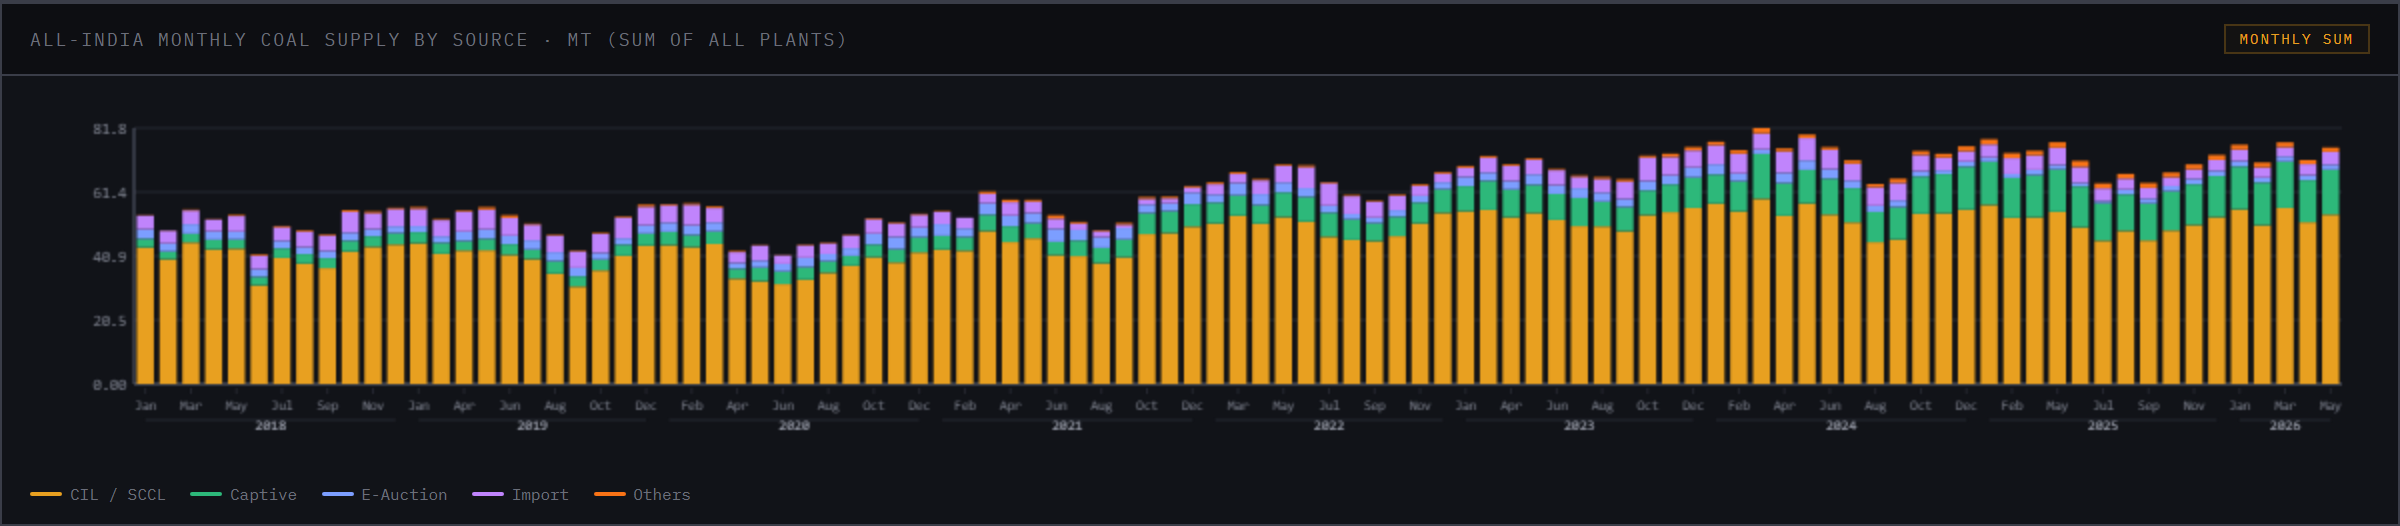 All-India monthly coal supply to power plants by source, in million tonnes. Source: Wattfeed dashboard.
In terms of the overall supply mix, captive and commercial blocks increased their share by +1.4 pp year-on-year to reach 19.0% of total supply, or 14.33 MT. The share from CIL & SCCL was broadly stable, rising +0.5 pp to 71.7% of the total with a volume of 54.17 MT.
Imported coal saw the largest shift in share, falling -1.7 pp to 5.4% of total supply. The absolute volume of imported coal received at power plants was 4.08 MT, a year-on-year decline of -25.8% from 5.50 MT in May 2025. Domestic supply stood at 71.50 MT, a small year-on-year change of -0.4%.
The reduction in reliance on imported coal is part of a consistent trend. Measured on a rolling twelve-month basis to remove seasonality, imported coal volumes were down -31.1%. The import share over the last twelve months was 5.0%, a change of -2.0 pp from the 7.0% share in the preceding twelve-month period.
Regional Pressures Vary
Every region in India recorded a coal supply deficit in May 2026, meaning plants in all five grids collectively burnt more coal than they received. The tightest balance was in the Northern region, which posted a supply-to-burn deficit of -1.78 MT, from burning 16.98 MT against a supply of 15.21 MT. The Western region had the next-largest deficit at -1.41 MT, followed by the Eastern region at -0.72 MT.
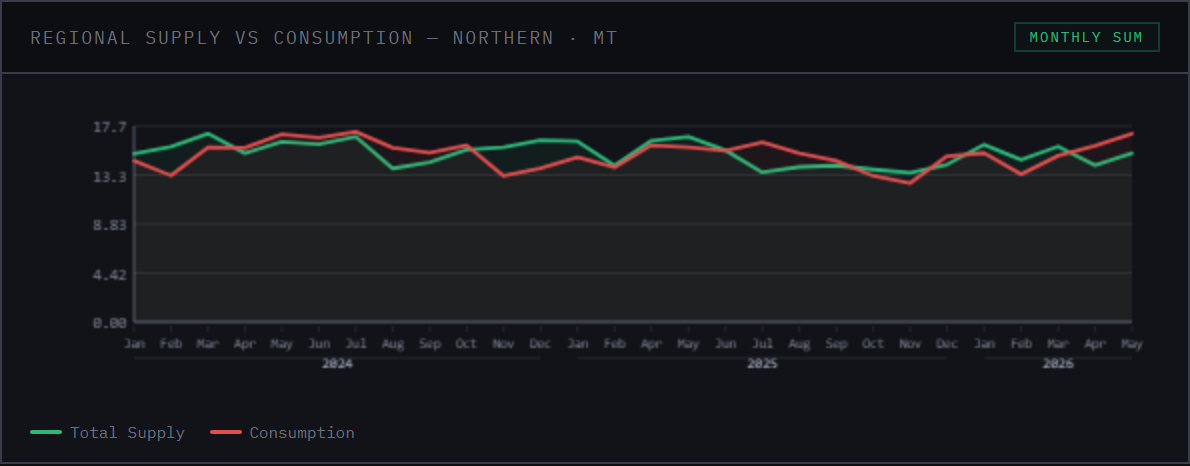 Regional coal supply against consumption, in million tonnes — Northern region. Source: Wattfeed dashboard.
These drawdowns affected regional stock levels differently. The Southern region held the lowest average stocks per station at 0.160 MT/plant, and these fell by -30.1% year-on-year. The Northeastern region also saw a steep fall of -30.9%. Northern region plants, while holding the highest average stock levels at 0.261 MT/plant, also experienced a significant year-on-year stock decline of -26.1%.
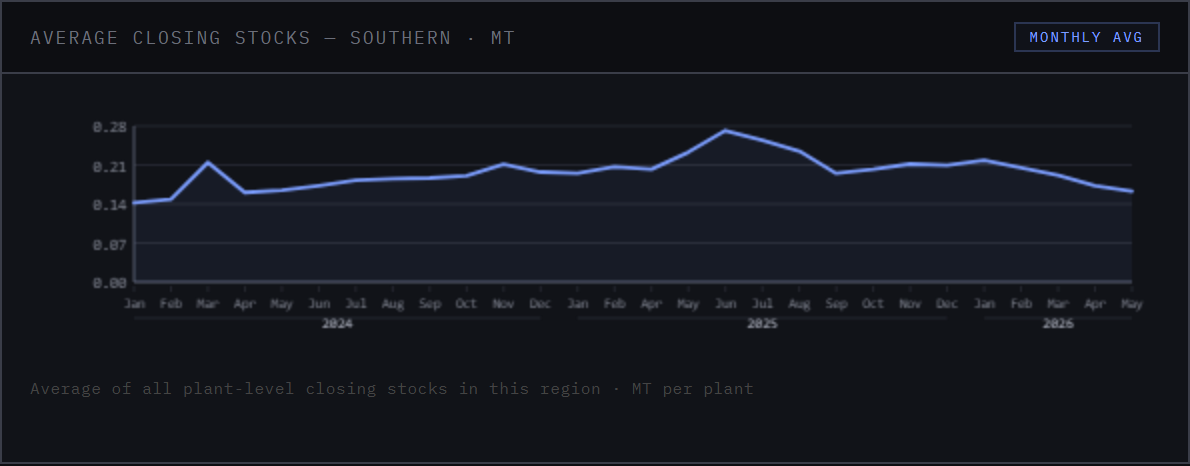 Regional average month-end closing stock per plant, in million tonnes — Southern region. Source: Wattfeed dashboard.
Divergent regional supply trends were a key factor. The Western region, which received the largest share of national supply at 29.52 MT, saw its receipts fall by -4.5% year-on-year. The Northern region experienced an even larger drop of -8.9%. In contrast, supply to the Southern region increased by 0.97 MT, or +6.9%, against May 2025. This increase in supply helped to moderate the stock drawdown in the South, resulting in a smaller regional deficit of -0.40 MT despite low absolute stock levels.
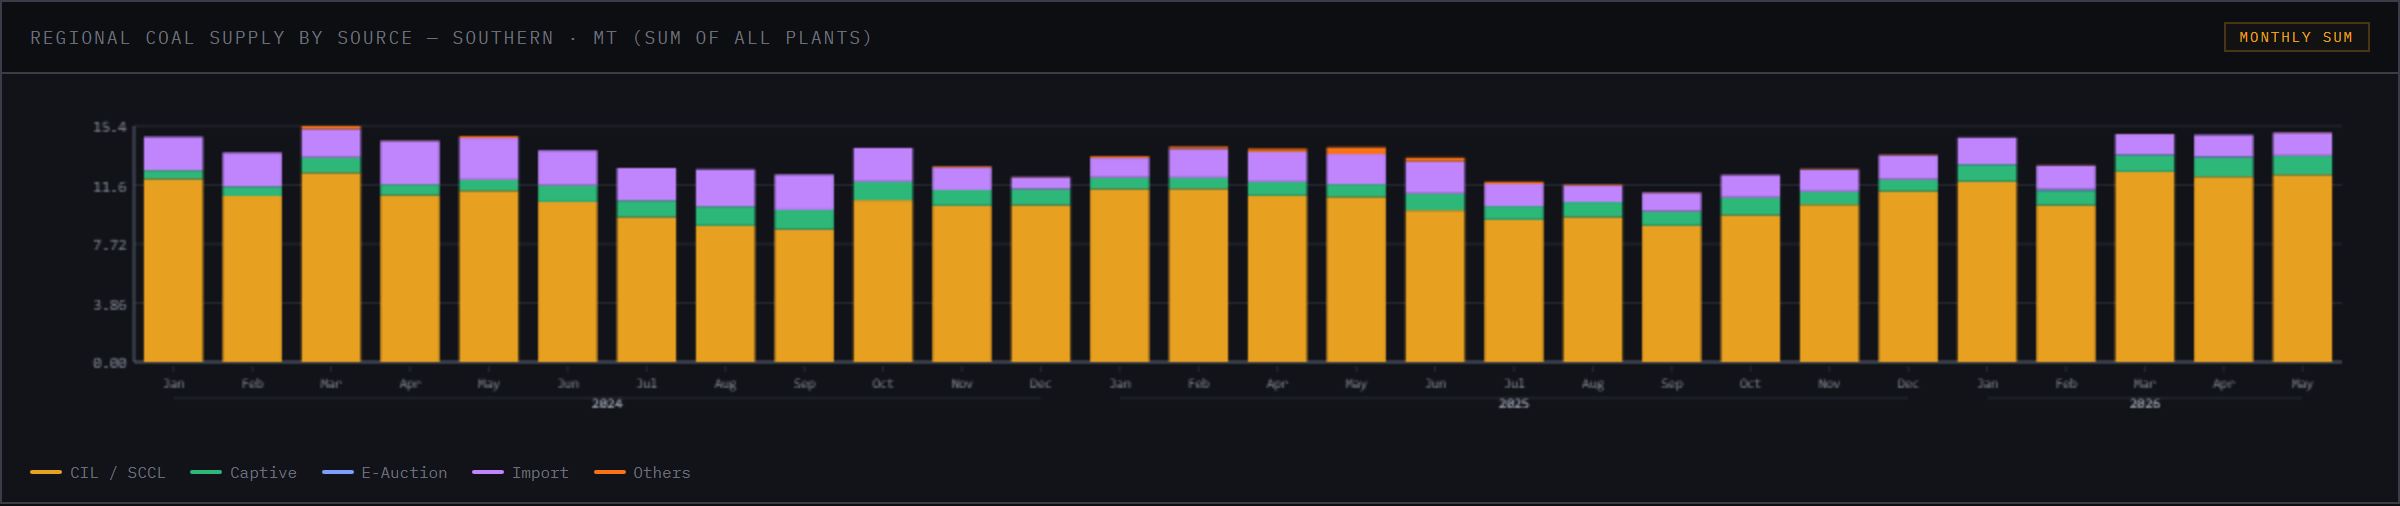 Regional coal supply by source, summed across all plants in the grid — Southern region. Source: Wattfeed dashboard.
All data used in this analysis can be found within the Wattfeed dashboard.