India’s power grid saw generation growth decouple from emissions growth in financial year 2024-25. Net generation, including renewable sources, grew by +5.1%, while carbon dioxide emissions from the sector grew by +2.6%. The resulting +2.5 pp decoupling gap indicates that the country was able to meet rising electricity demand while moderating the associated increase in carbon output.
This outcome was driven by a record expansion in renewable energy, which supplied a larger share of the grid than ever before. However, the year also saw new highs for both absolute emissions and total power generation, reflecting the continued centrality of fossil fuels in meeting the country’s energy needs.
A Greener Mix
The primary driver of the decoupling was the performance of renewable energy sources. Net generation from renewables reached a record high of 255.0 TWh in FY25, an increase of +12.9% over the previous year. This pushed the share of renewables in the net generation mix to 14.9%, up from 13.8% in FY24.
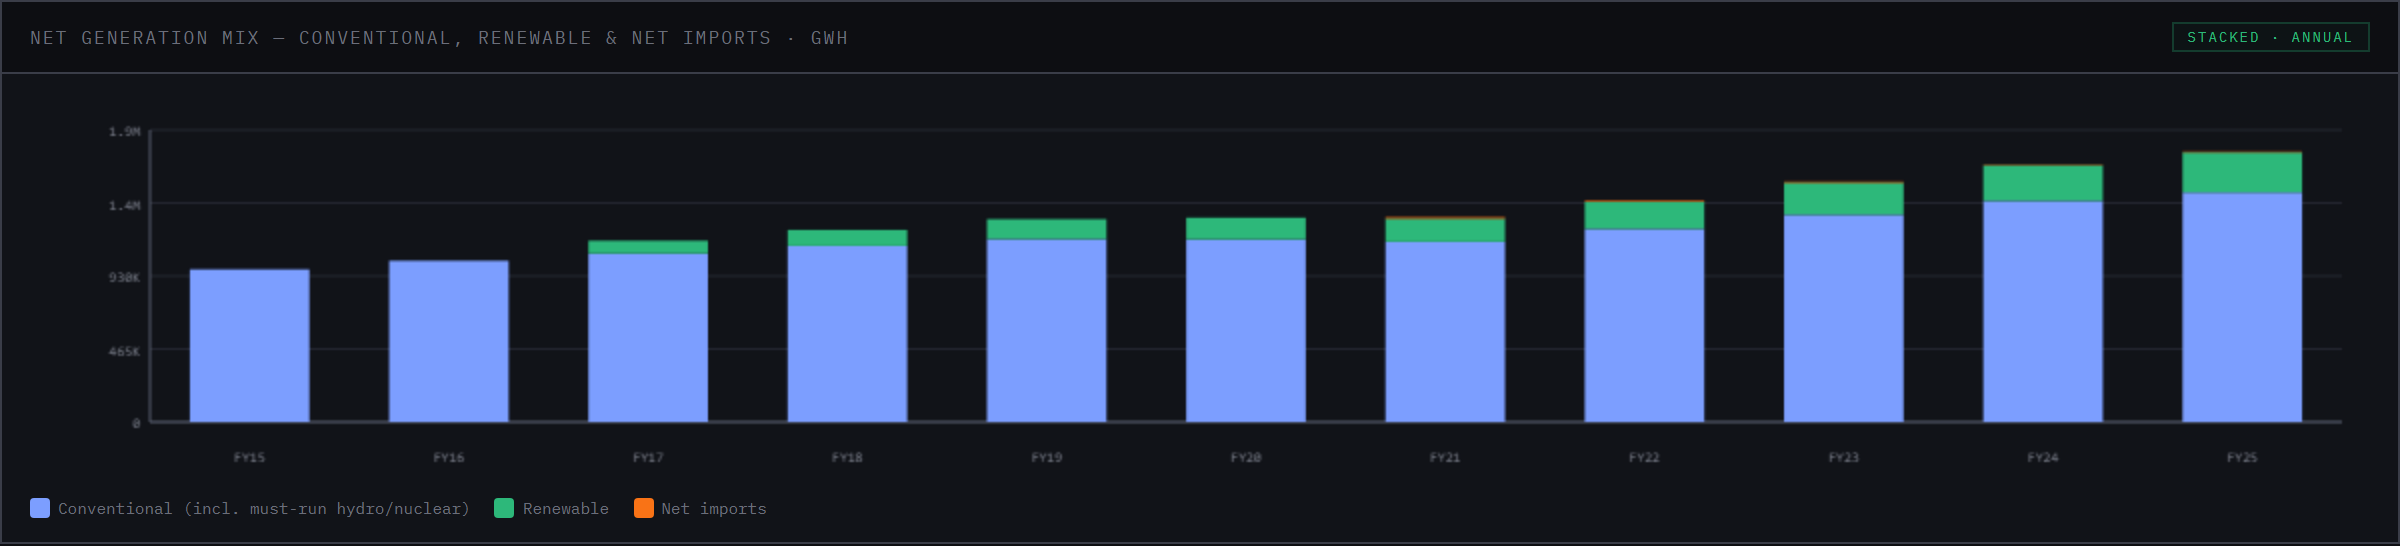 Net generation mix: conventional, renewable and net imports. Source: Wattfeed dashboard.
This increase in clean generation allowed the system to accommodate a surge in overall power demand without a proportionate rise in emissions. Total net generation, inclusive of all sources, also reached a new record of 1716.9 TWh in FY25. The ability to meet this new peak with a generation growth rate that was double the emissions growth rate is a significant development.
Intensity Falls
The changing generation mix led directly to a reduction in the grid’s carbon intensity. The grid emission factor — a whole-system metric that includes renewables and is used to assess the carbon footprint of electricity consumption — fell to 0.712 tCO2/MWh in FY25. This represents a year-on-year change of -2.4%.
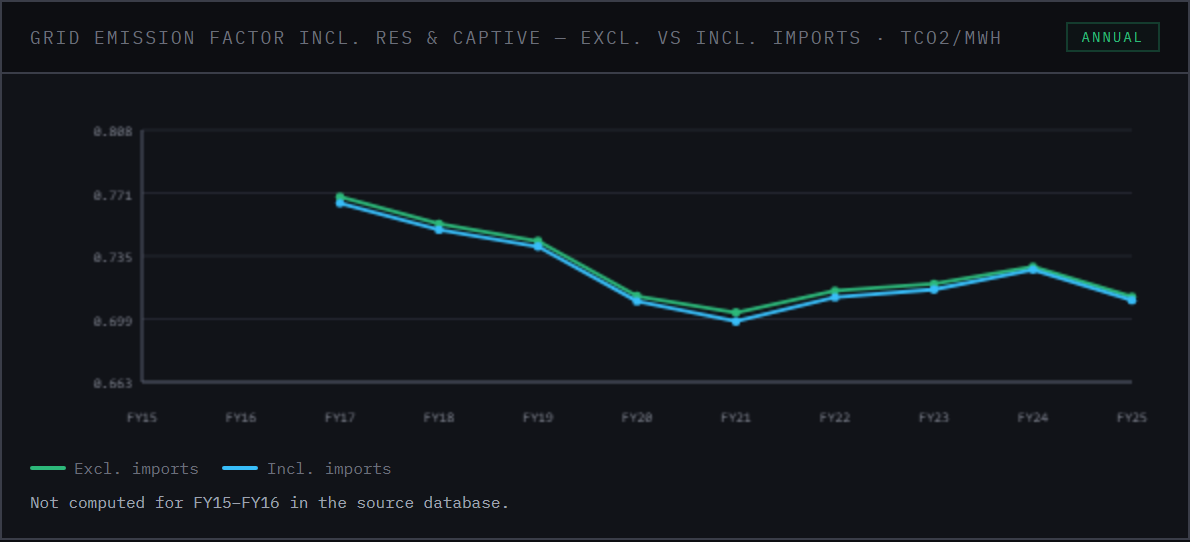 Grid emission factor including renewables and captive generation. Source: Wattfeed dashboard.
Examining the thermal fleet in isolation reveals a similar, though less pronounced, trend. The weighted average emission rate for thermal generation fell by -1.2% year-on-year to 0.834 tCO2/MWh. This smaller improvement suggests that while there may be some operational efficiency gains within the thermal fleet, the larger driver of decarbonisation is the displacement of fossil fuels by zero-emission renewables.
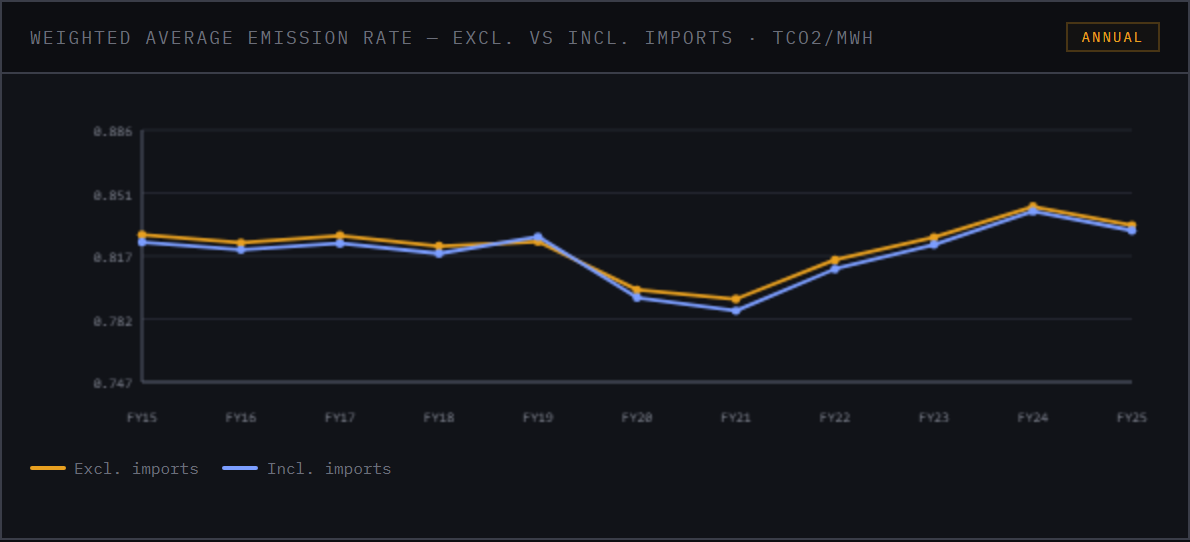 Weighted average emission rate, excluding and including imports. Source: Wattfeed dashboard.
By fuel, lignite remained the most carbon-intensive source at 1319.922 tCO2/MWh in FY25, followed by coal at 969.066 tCO2/MWh. Gas-fired generation was significantly cleaner, with an intensity of 452.333 tCO2/MWh.
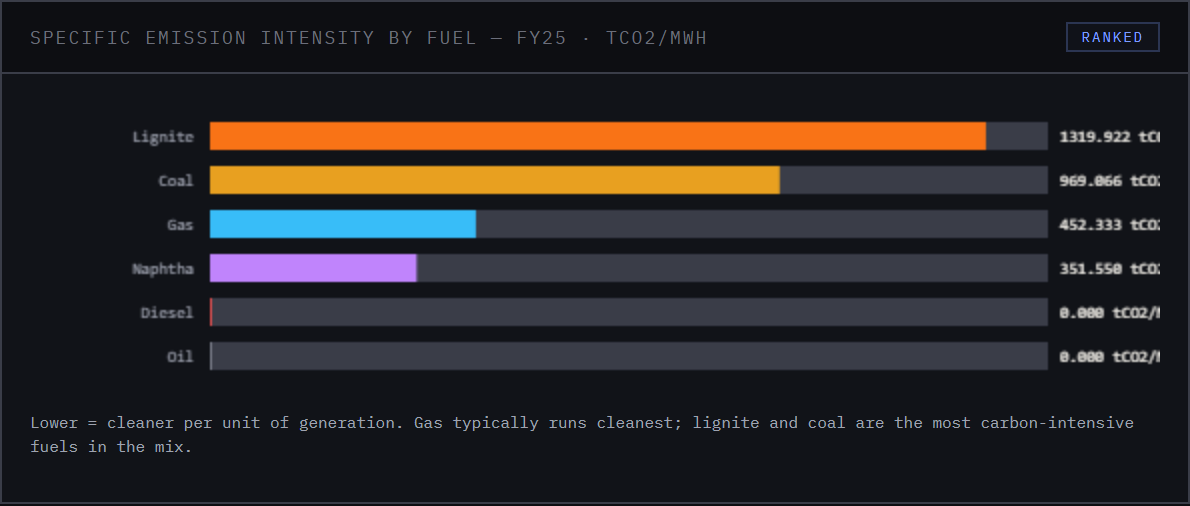 Specific emission intensity by fuel, latest financial year. Source: Wattfeed dashboard.
Absolute Emissions and the Coal Fleet
Despite these relative improvements in carbon intensity, India’s absolute power sector emissions rose to a new record high. The total for FY25 was 1234.2 MT, an increase of +2.6% over the 1203.4 MT recorded in FY24.
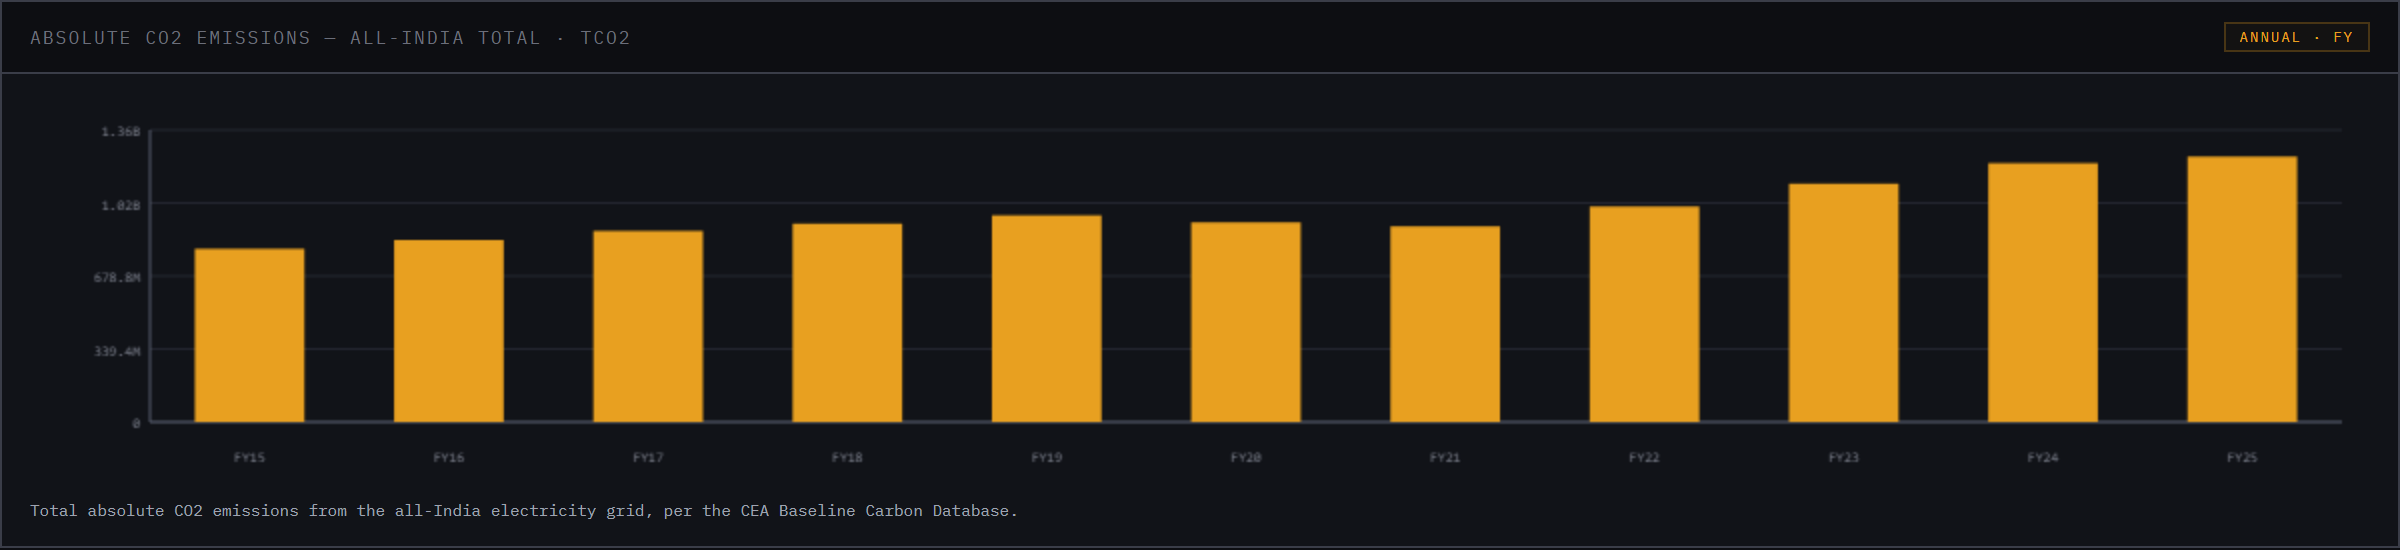 Absolute CO2 emissions, all-India total, by financial year. Source: Wattfeed dashboard.
This growth, while representing a new peak, was considerably slower than in preceding years. The emissions total for FY25 came in -6.6% below the level that would be implied by extrapolating the prior three-year compound annual growth rate of +9.8%. This marks a significant break from the recent trend of rapid emissions growth.
The increase in absolute emissions was overwhelmingly driven by coal. Of the 30.02 MT total increase in thermal emissions between FY24 and FY25, coal-fired generation was responsible for a change of 30.57 MT. Emissions from lignite and gas saw small declines, at -0.44 MT and -0.11 MT respectively.
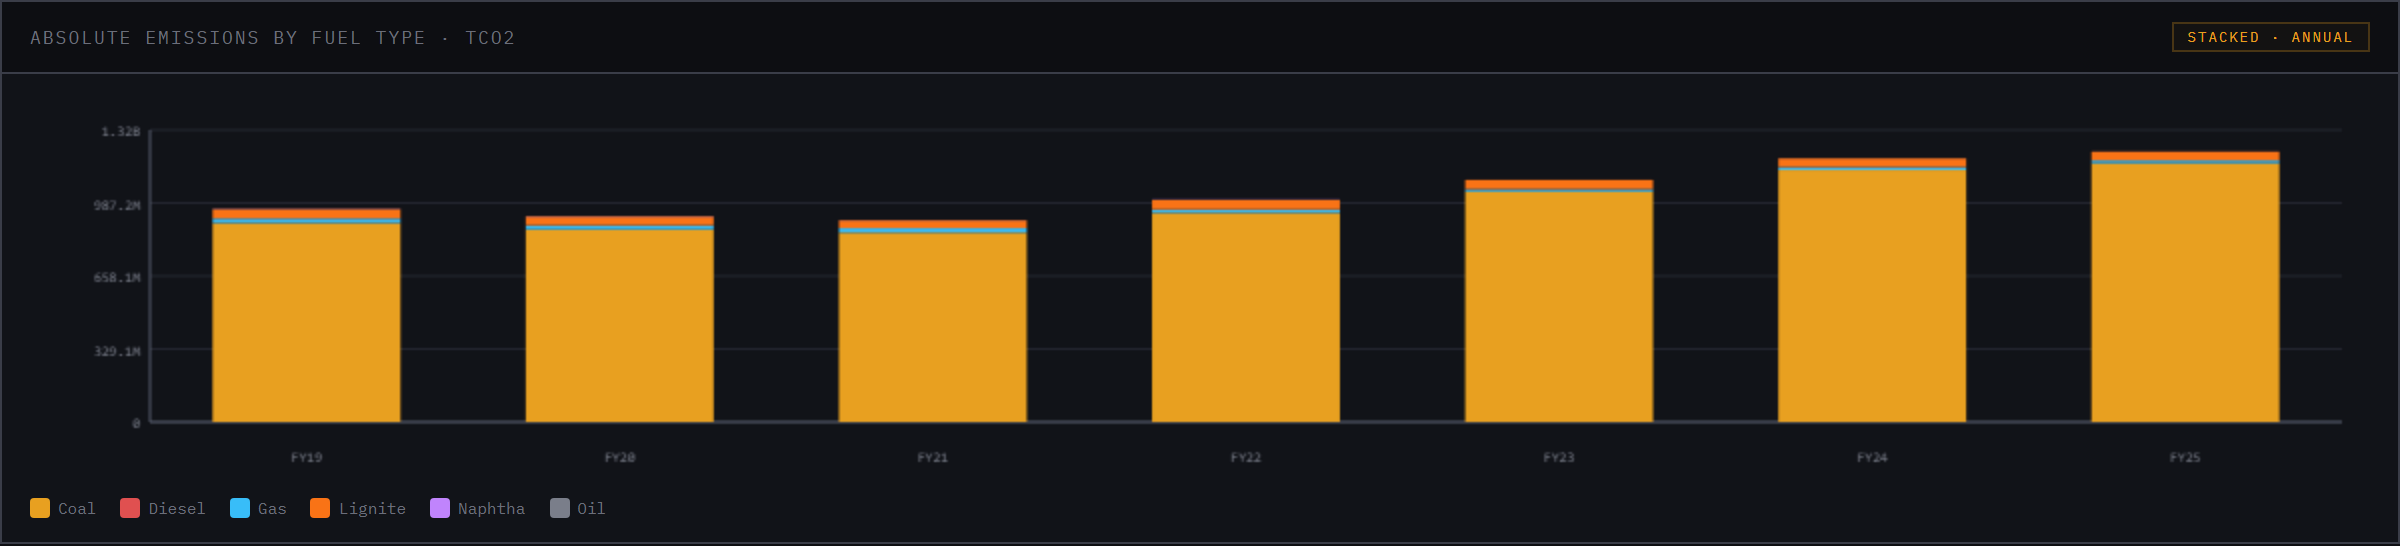 Absolute emissions by fuel type. Source: Wattfeed dashboard.
The State-Level Picture
Emissions from thermal power generation remain highly concentrated geographically. The top five emitting states accounted for 51.8% of the national total in FY25.
Chhattisgarh was the single largest source of thermal power emissions, with a total of 148.0 MT. It was followed by Uttar Pradesh (144.9 MT), Madhya Pradesh (130.2 MT), Maharashtra (122.1 MT), and West Bengal (85.9 MT).
In terms of year-on-year changes, Uttar Pradesh saw the largest absolute increase in emissions, rising by 7.02 MT. Gujarat followed closely with an increase of 6.90 MT, a +9.7% rise for the state. Conversely, several major states saw their emissions fall. Madhya Pradesh and Maharashtra recorded the largest declines, with their emissions falling by -2.18 MT and -2.13 MT respectively. At the plant level, TELANGANA STPP in Telangana recorded the largest single increase in absolute emissions among large plants, with a change of 6.17 MT.
There remains a wide disparity in the carbon intensity of state thermal fleets, reflecting differences in technology, fleet age, and fuel quality. The specific emission factor for Tamil Nadu’s fleet was the highest in the country at 1095.250 tCO2/MWh, while Delhi’s was the lowest at 412.728 tCO2/MWh.
Carbon Accounting Implications
The shifting dynamics of the Indian grid are reflected in the reference values used for carbon credit accounting under the Clean Development Mechanism (CDM). The build margin, which reflects the emissions profile of recent capacity additions, fell by -7.3% in FY25 to a value of 0.512. This sharp drop is a direct consequence of the large-scale addition of renewable capacity to the grid.
The simple operating margin, which reflects the existing fleet, remained stable. The combined margin, a weighted average of the two, stood at 0.738 for the year.
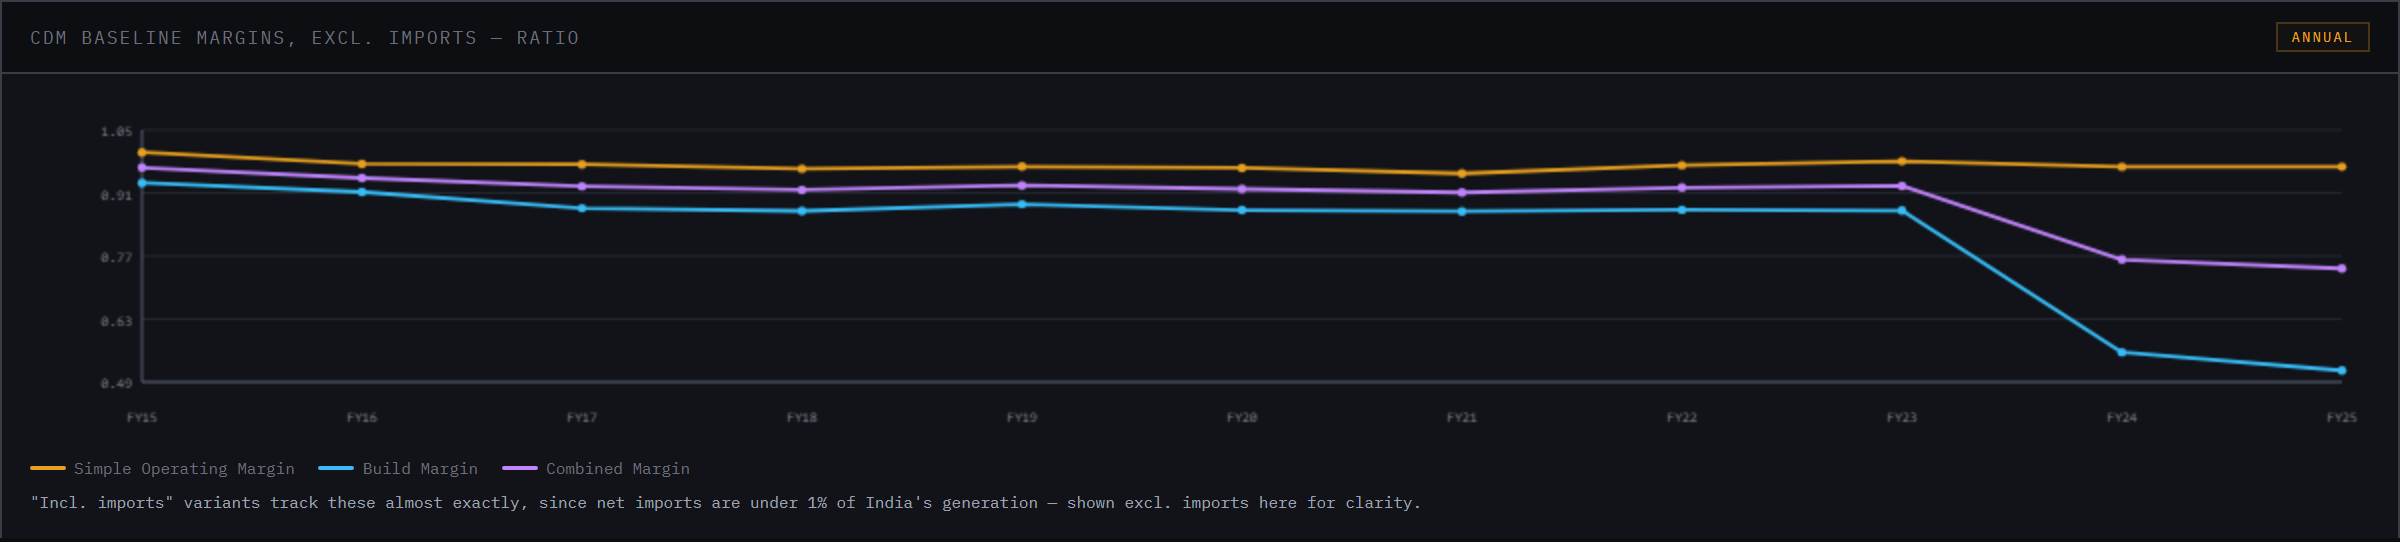 CDM baseline margins, excluding imports. Source: Wattfeed dashboard.