On 21 May 2026, India's daytime peak demand hit 270,820 MW at 15:45. That is the highest solar-hour peak anywhere in this dataset, which NLDC has been reporting since January 2024.
Eight months earlier, in September 2025, the daytime peak lost to the night-time peak on all thirty days of the month. Every single one.
Both things are true, and the tension between them is the whole story.
The night keeps winning
NLDC splits each day in two. Solar hours run 06:00 to 18:00, non-solar hours cover 18:00 to 06:00, and it reports the highest demand met in each window separately. Most of the time the day wins, because that is when factories run and offices cool themselves.
Most of the time.
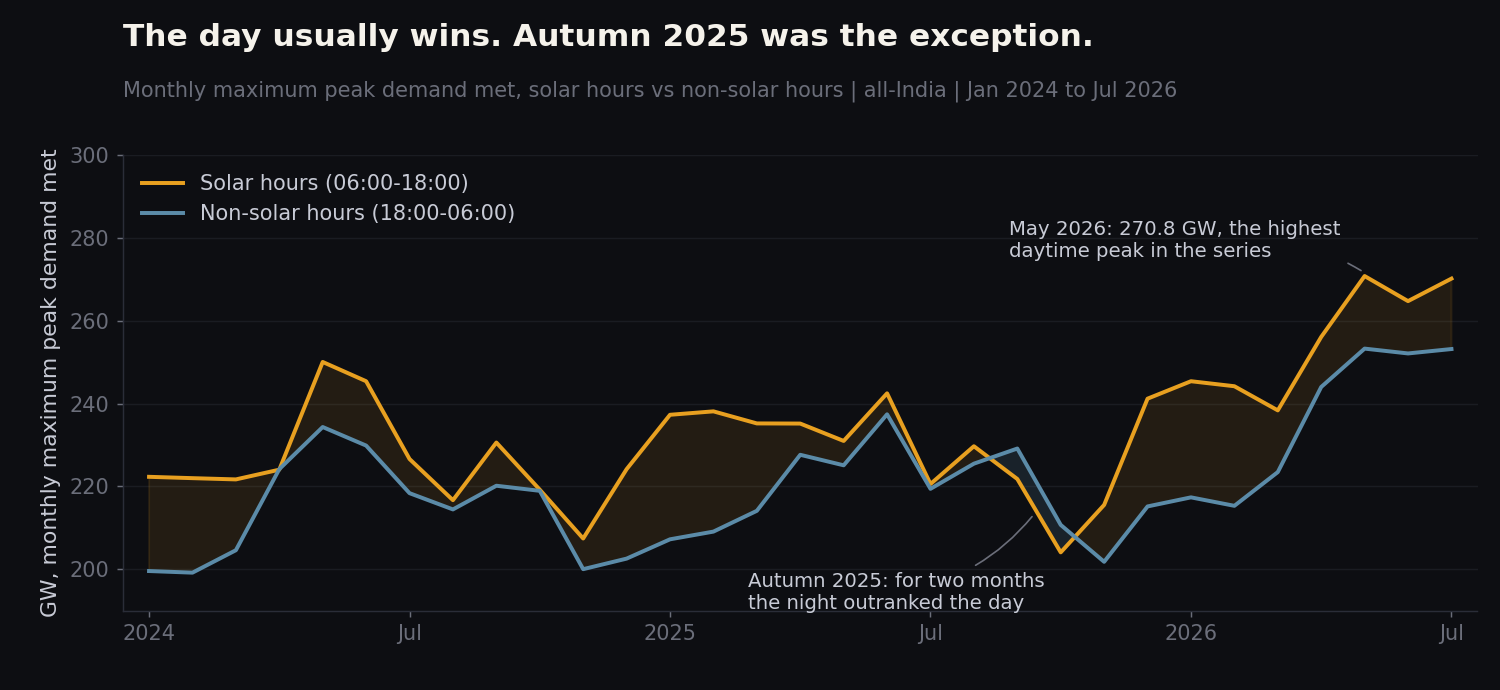 Monthly maximum peak demand met in each window, all-India. The two lines cross in autumn 2025 and again briefly in April 2024. Source: Wattfeed dashboard.
In 2024, the night peak beat the day peak on 109 days. In 2025 that jumped to 166 days, close to half the year. September 2025 went 30 for 30, October 2025 went 28 for 31, and across those two months the night peak ran an average of 8 GW above the day peak.
Then 2026 pulled it back. January to July has produced 48 crossover days against 69 in the same stretch of 2025.
The seasonal pattern underneath is absolute, and it hasn't wobbled once in three years. January, February and December have never produced a single crossover day. Not one, across all three years in the file. In winter the daytime peak wins by 20 to 26 GW and it isn't close.
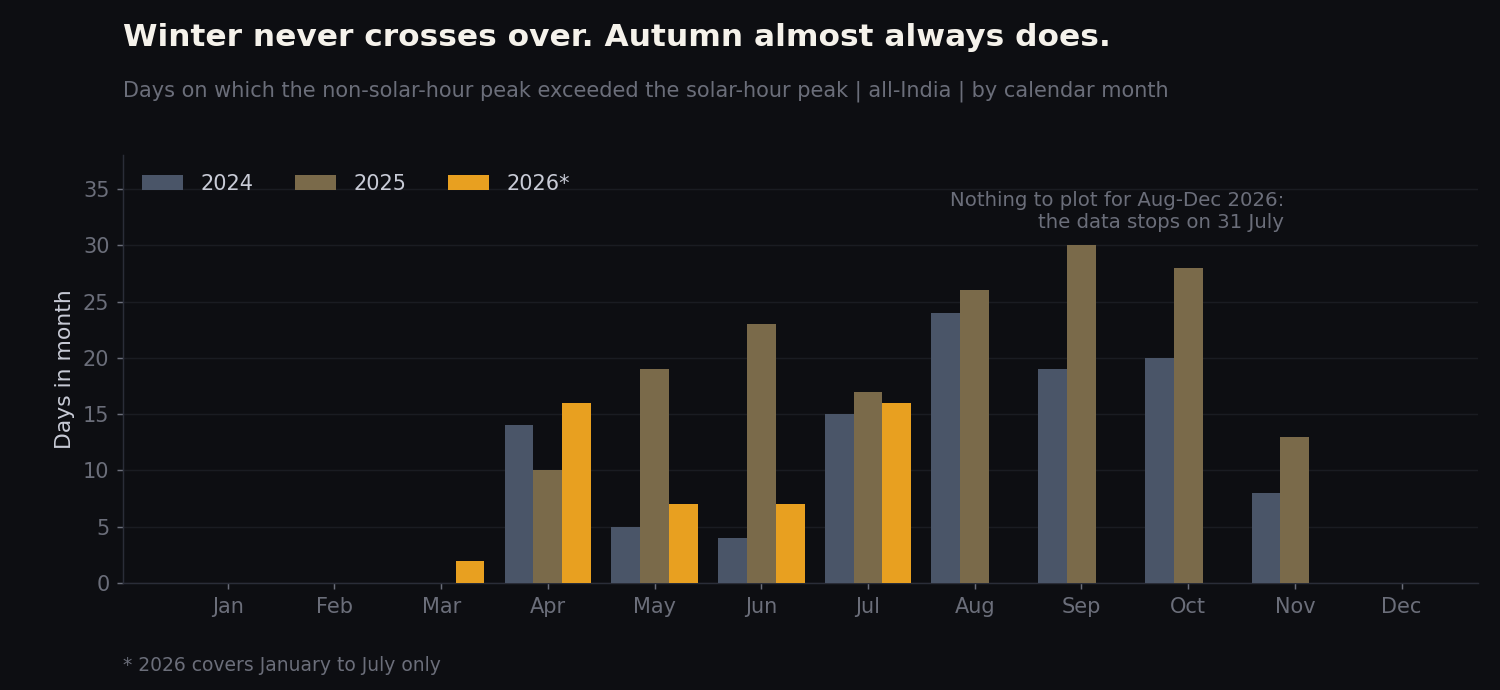 Days on which the non-solar-hour peak exceeded the solar-hour peak, by calendar month. 2026 runs to 31 July only. Source: Wattfeed dashboard.
Solar is feeding the day, not flattening it
The tidy assumption is that more solar squashes the daytime peak. Rooftops and utility-scale farms pour power in at noon, demand met from the grid falls, curve flattens, everyone writes a report about it.
The data says the opposite is happening.
Solar generation over January to July went from 73,366 GWh in 2024 to 122,577 GWh in 2026, a rise of 67% in two years, with May 2026 setting an all-time monthly record of 19,745 GWh. Over the same window the daytime peak didn't flatten. It grew, and in the winter months the gap over the night peak actually widened: an average of 20.3 GW in January 2024, 23.9 GW in January 2025, 26.3 GW in January 2026.
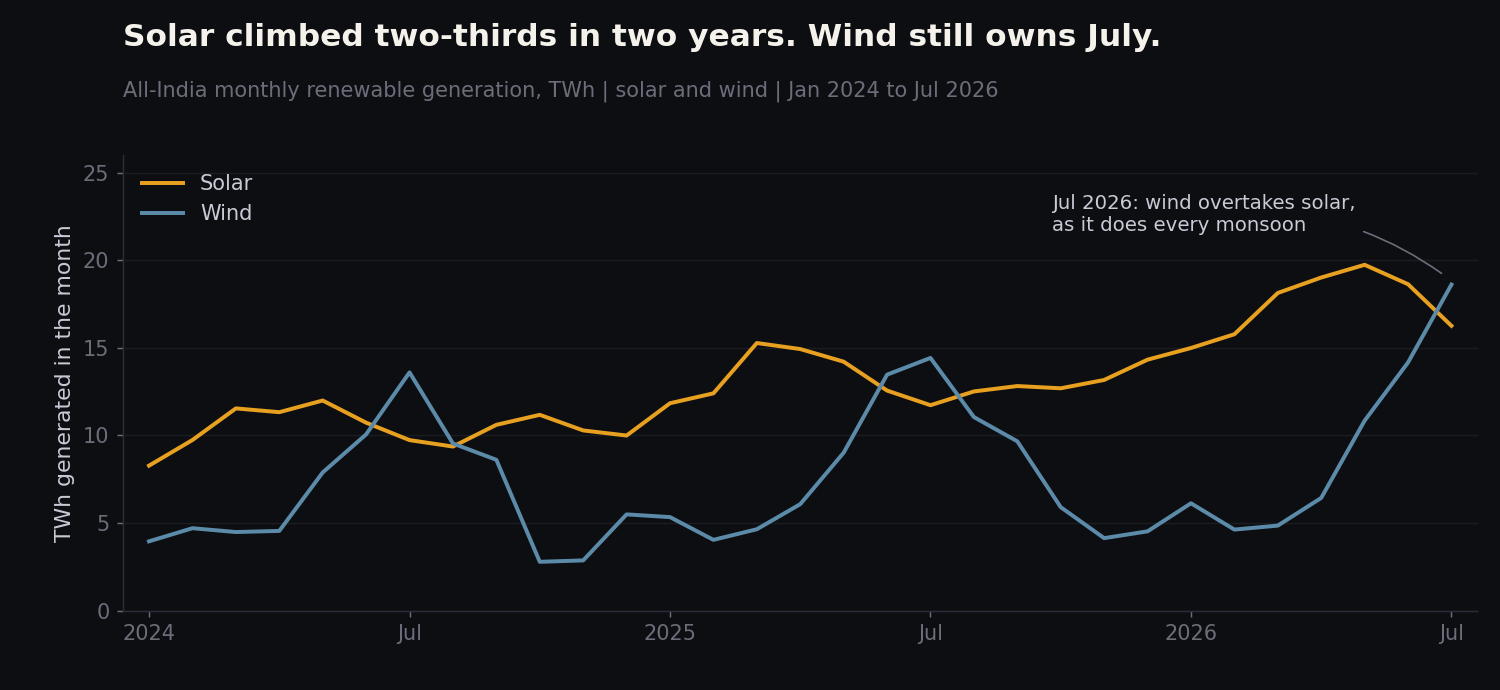 Monthly solar and wind generation as reported by CEA. Solar's floor keeps rising; wind's shape stays stubbornly seasonal. Source: Wattfeed dashboard.
This isn't a contradiction, it's a definition. Peak demand met is gross demand, not demand net of renewables. Solar doesn't subtract from that number, it helps serve it. What solar has actually done is make the middle of the day a cheap place to put load, and load has duly turned up. The daytime peak isn't being suppressed by solar. It is being enabled by it.
Back in early 2024 the daytime record sat at 250,070 MW. Two years on it's twenty gigawatts higher. The curve went up, not flat.
Wind works the late shift
Here's the part that complicates everything.
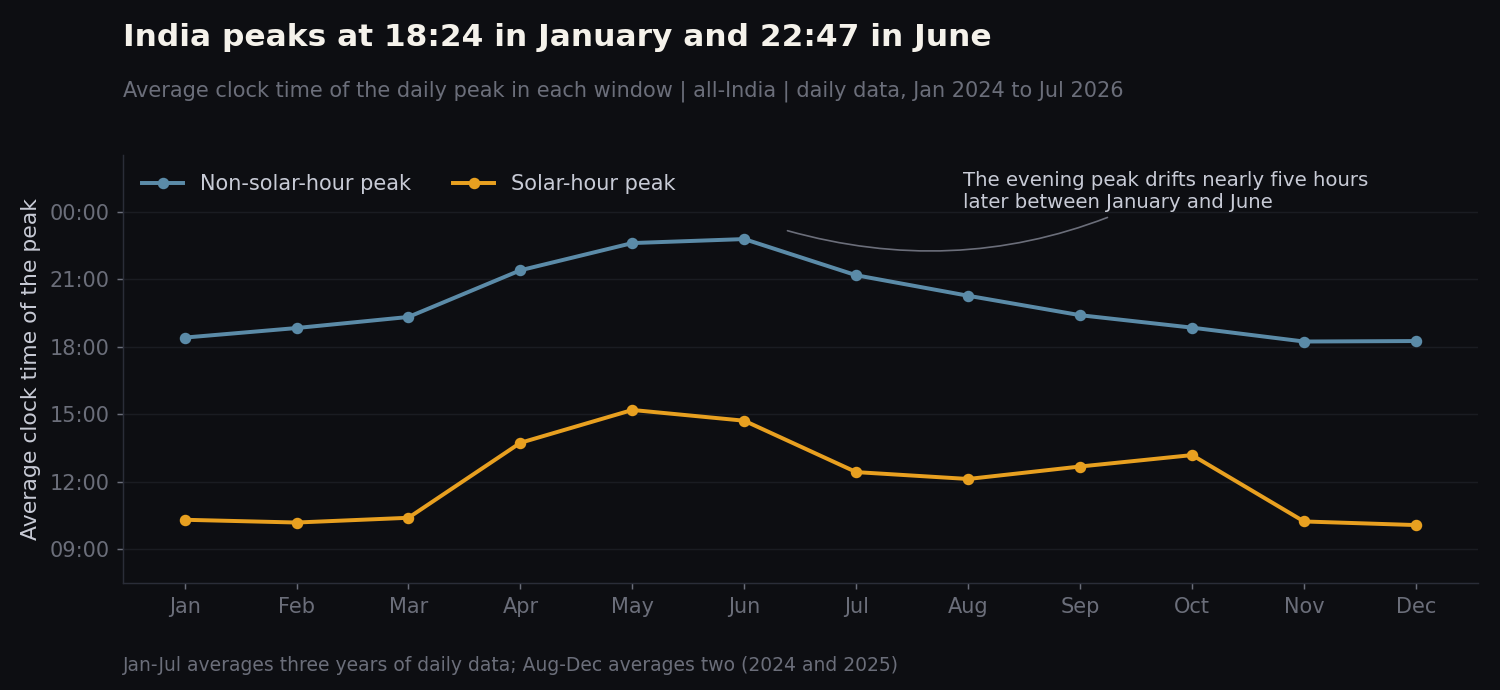 Average clock time of the daily peak, by calendar month. January to July averages three years of daily data; August to December averages two. Source: Wattfeed dashboard.
In January the evening peak lands at 18:24 on average, and in every single January day across three years it arrived before 19:00. Lights come on, everyone gets home, the grid spikes, done. By June the average is 22:47, and on 96% of June days the peak lands after 22:00.
That is a swing of nearly four and a half hours in when the country's night-time maximum occurs. It's air conditioning, and it's people not going to bed. The evening peak doesn't just get bigger in summer, it gets patient, sitting there until nearly eleven at night waiting for bedrooms to cool.
Solar has been off the clock for four hours by then.
Wind hasn't. July 2026 produced 18,617 GWh of wind, the largest wind month in a series that runs back to 2014, and wind out-generated solar that month for the fifth time since January 2024. The monsoon months are precisely when the night peak crowds closest to the day peak, and wind is the one variable renewable that shows up for that shift. By November wind falls to under a third of its July output, the evening peak retreats to an average of 18:14, and the day comfortably wins again.
So the two renewables aren't competing. They're covering different halves of a very differently-shaped day, in different seasons, and the grid's flexibility problem lives in the gap between them.
What happens next
Expect the autumn 2026 crossover season to return, though probably shallower than 2025's. September and October have gone to the night peak in both years on record, and the January-to-July 2026 crossover count is already running below 2025's. If the pattern holds, look for somewhere between 40 and 55 crossover days across September and October rather than 2025's 58.
The daytime peak should clear 280 GW during the 2027 summer. May 2026 came in 20.8 GW above May 2024. That is a two-year gain, and 2025 sat below both. That extrapolation assumes a hot April to June, which is not guaranteed, and 2025 is the cautionary case: its May peak actually came in below 2024's.
The June evening peak will keep sitting after 22:30. It averaged 23:02, 22:31 and 22:46 across the last three Junes, drifting by half an hour but never once heading for an earlier evening. Nothing in the current mix moves that hour earlier.
Wind's July record probably falls again within two years. It has set a new monthly high in each of the last three monsoons. That's the sort of streak that ends without warning, since wind years are weather years, but the direction of the capacity build points the same way.
Watch the winter gap, not the summer one. It has widened by 6 GW in two Januaries while everyone was looking at the summer numbers. If it clears 30 GW next January, the daytime load story is running faster than the headline peak suggests.
The grid has quietly reorganised itself around a country that cools its bedrooms at eleven at night and runs its factories at three in the afternoon. Solar turned up for one of those. The other is still waiting.
All data used in this analysis can be found within the Wattfeed dashboard.