On 1 November 2025, India had 85.7 GW of generating capacity sitting out of service. That is the most on any single day since October 2022, and it is a genuinely large number: roughly the entire installed capacity of the United Kingdom, parked.
Seven months later, in June 2026, the fleet averaged 36.7 GW out. Less than half.
Nothing structural happened to the grid in between. No plants were built at that speed, none were retired at that speed. What changed was the calendar.
The summer swerve
Here is the pattern that runs through the whole decade of CEA outage data, and it has been getting stronger every year: Indian generators come off the bar in autumn and winter, and they come back on for summer.
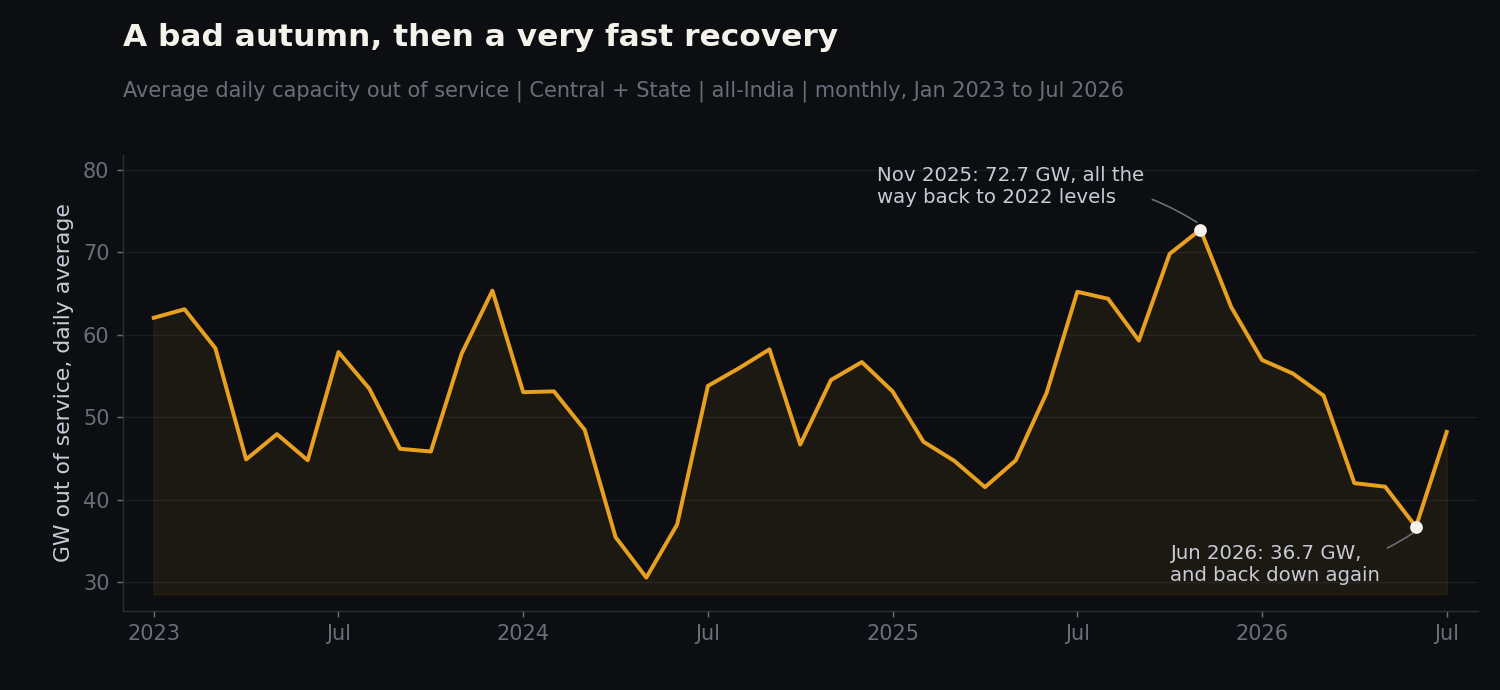 Average daily capacity out of service across central and state generating units, all-India. The autumn 2025 run is the highest in three years; June 2026 is the lowest month since May 2024. Source: Wattfeed dashboard.
Compare April to June against October to December in the same year and you get a clean measure of how hard the fleet leans into that swing. In 2016 the summer quarter ran about 9% below the autumn one. Barely a lean. By 2024 the gap was 35%, and in 2025 it was 32%.
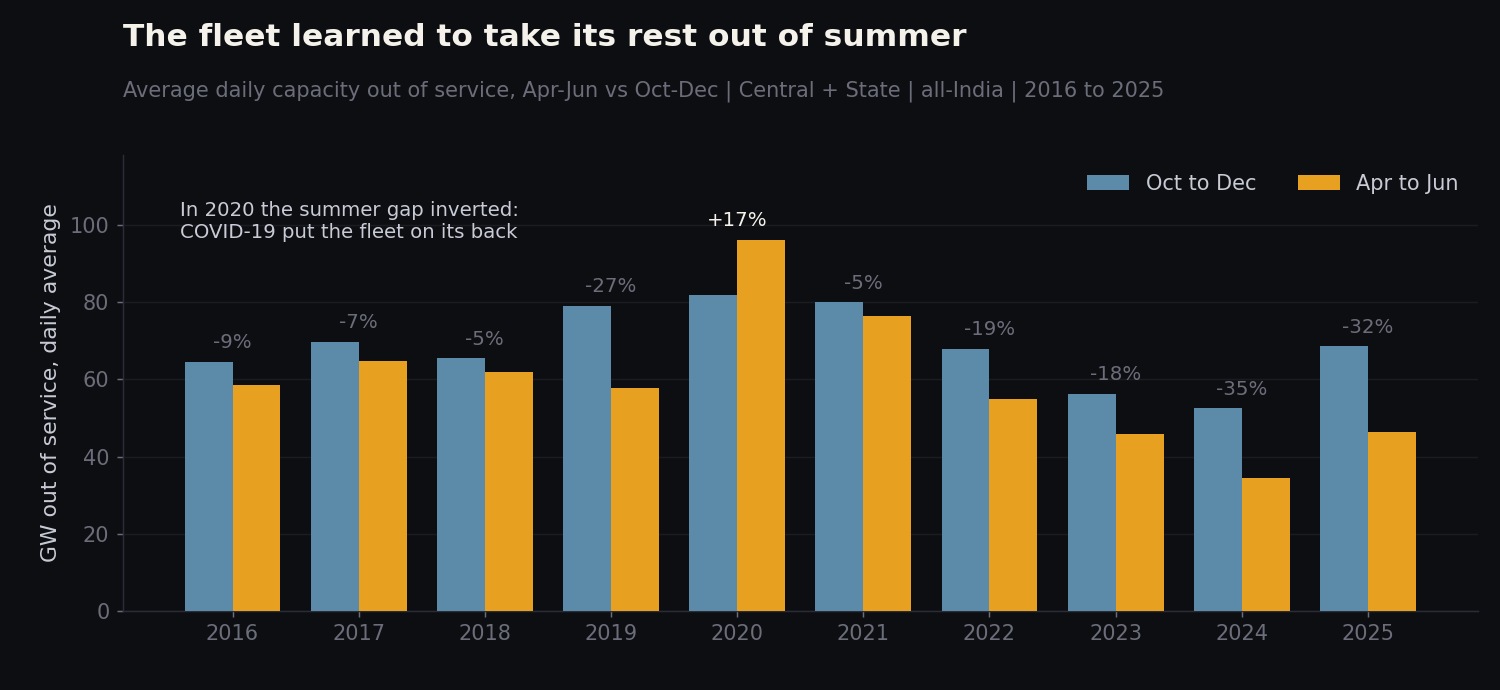 The seasonal gap has widened from single digits to roughly a third. The 2020 inversion is COVID-19, when demand collapsed and units came off in April instead. Source: Wattfeed dashboard.
Back in 2016 the fleet treated all twelve months as roughly interchangeable, which in hindsight looks like an odd thing to do in a country where May decides everything. Now the discipline is obvious. Units go down when the grid can spare them and stay up when it can't, and the shape of that decision has become sharper every year.
2026 so far has followed the script exactly. January started at 56.9 GW, the number ground down through spring, and June landed at 36.7 GW, the third-lowest month in the entire ten-year series. Across January to July, 2026 is averaging 47.6 GW against 50.0 GW for the same stretch of 2025. A 4.7% improvement, on top of an already good baseline.
One caveat worth stating plainly: 2026 only runs to July here, so its full-year figure isn't comparable to earlier years yet. The like-for-like numbers above are all January to July on both sides.
States fixed themselves
Split the fleet by ownership and the decade looks like two entirely different stories.
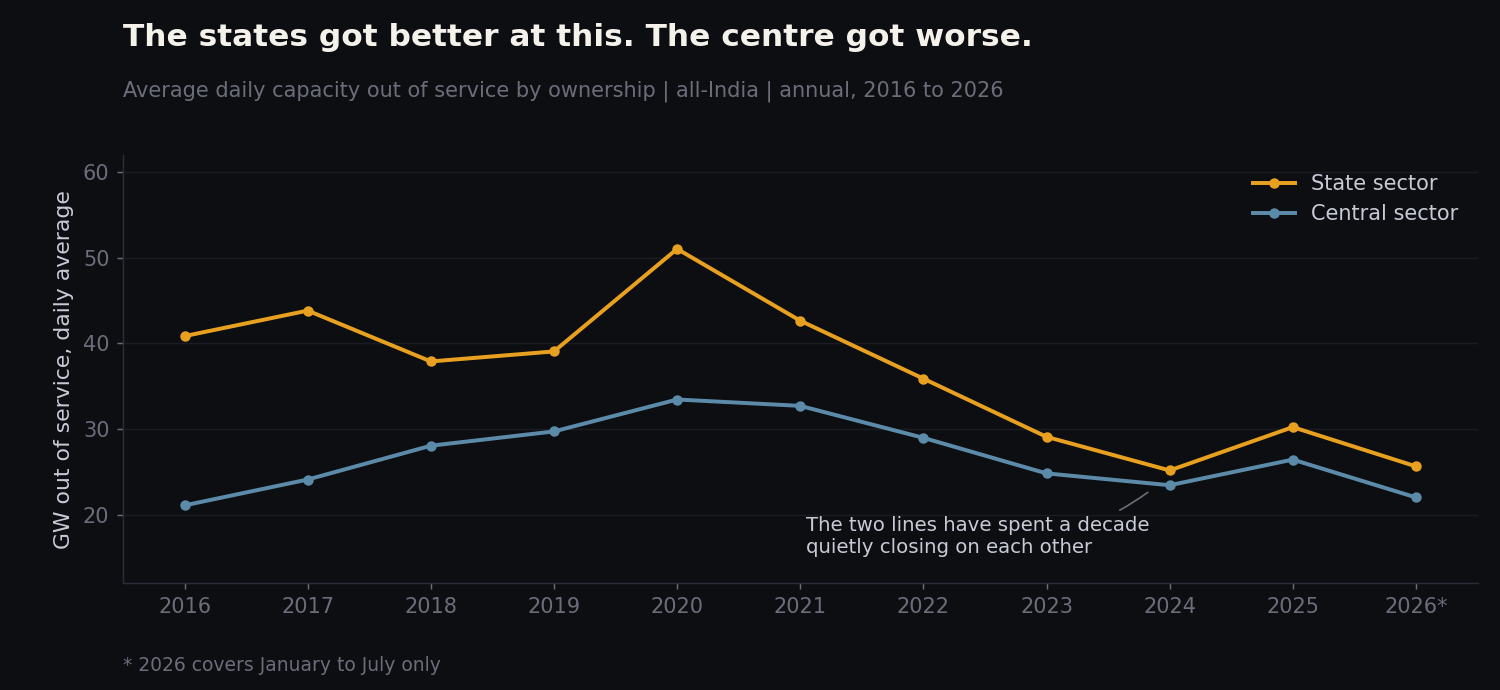 Average daily capacity out of service by ownership. 2026 covers January to July only. Source: Wattfeed dashboard.
State-sector plants averaged 40.9 GW out in 2016. By 2024 that was 25.2 GW, a cut of nearly two-fifths. Central-sector plants went the other way: 21.1 GW in 2016, 26.4 GW in 2025. Up about a quarter.
The consequence is a slow role reversal that almost nobody talks about. In 2016, the central fleet accounted for 34% of all capacity out of service. It now sits near 46%, and in 2024 it briefly touched 48%. Put it another way: in 2016 there was not a single day when more central capacity was out than state capacity. In 2024 that happened on more than a third of days.
Some of this is arithmetic rather than decline. The central fleet has grown, and a bigger fleet takes more maintenance in absolute terms. But the state fleet has grown too, and its outage went down anyway. Whatever the state utilities did to their availability over the past eight years, it worked, and the numbers say so more loudly than anyone's press release does.
2025 interrupted the run. State outage jumped back to 30.2 GW from 25.2 GW, and October and November were rough on both sectors, running 41% above the same two months of 2024. The Jan-Jul 2026 numbers suggest that was a bad year rather than a new trend, but it's a single data point and worth watching.
Two regions off-script
The clean national story falls apart the moment you split it by region.
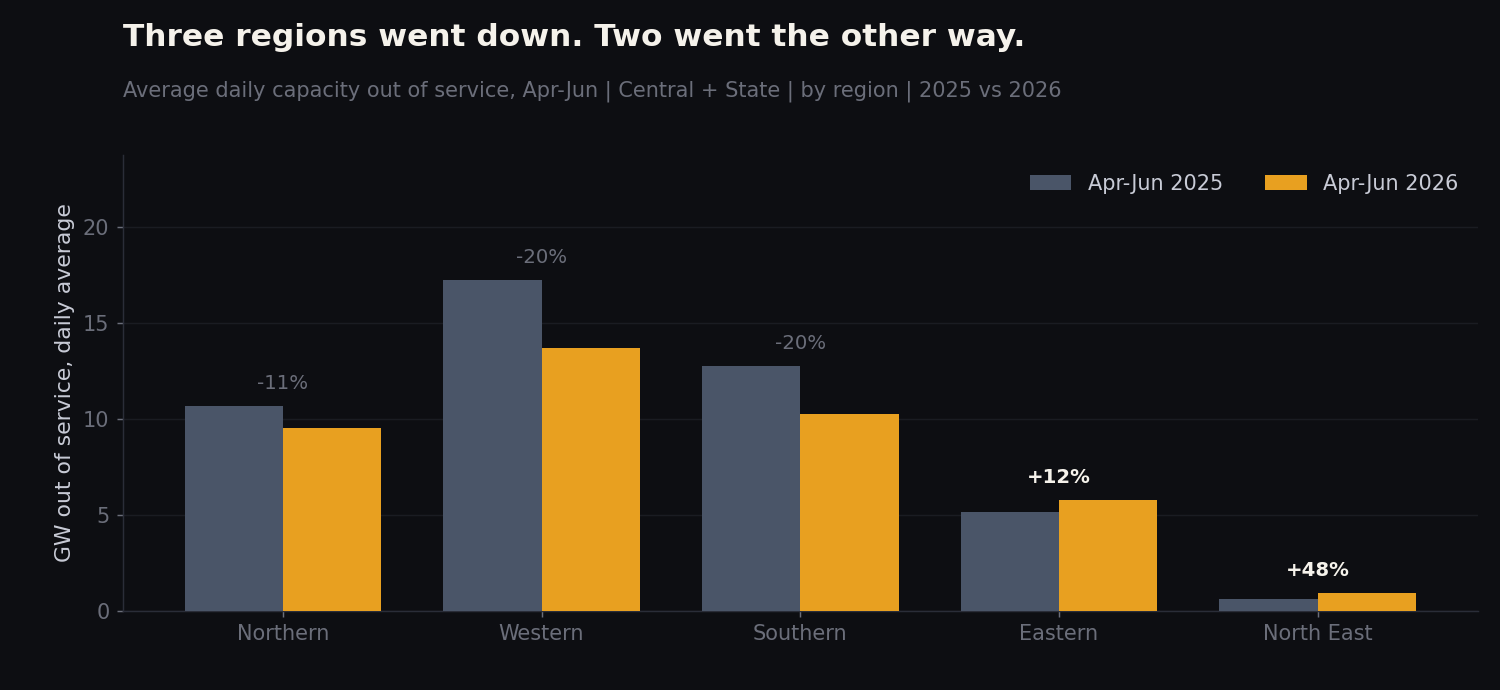 Average daily capacity out of service in the April to June window, by grid region. Source: Wattfeed dashboard.
Northern, Western and Southern all did what you'd expect this summer. Western cut its April-June outage by 20% year on year, Southern by 20%, Northern by 11%. Eastern went up 12%. North Eastern went up 48%.
North Eastern is small enough that a couple of units moving swings the whole regional number, so treat the percentage with care. Still, it's the only region whose outage has climbed in three consecutive summers, and its share of the national total has jumped from 1.2% in 2025 to 2.0% in 2026. On a base that small, that's a doubling of visibility.
Eastern is the more interesting one. Central-sector outage there went from 2.4 GW in 2023 to 4.0 GW in 2024 and has stayed near that level since. Meanwhile state-sector outage in the East has fallen from 5.5 GW in 2016 to 2.5 GW now. The East is the one region where the central fleet is decisively the larger source of unavailability, and it got there in a single year.
The price line goes the wrong way
You would expect capacity coming off to tighten the market. The data politely declines to cooperate.
October 2025 was the second-worst outage month in three years. It was also the cheapest month in the entire IEX day-ahead series, clearing at ₹2,669/MWh, with RTM at ₹2,725/MWh. November 2025 was worse for outages still, and DAM cleared at ₹3,069/MWh, the second-cheapest month on record. Across all of 2025, outage was up 17% on 2024 and DAM averaged ₹3,993/MWh, its lowest annual figure since the series began in mid-2022.
Then June 2026 arrived with the lowest outage in two years, and DAM cleared at ₹5,168/MWh.
That's the opposite of the naive intuition, and it's the right way round once you think about it for ten seconds. Outage largely follows the market rather than driving it. Autumn is when renewables are still generous, hydro is full and demand has come off the summer boil, so that is exactly when the system can afford to let capacity go. Prices are low for the same reasons the plants can stand down. Summer is when demand is enormous, so everything runs, and everything is expensive.
We're deliberately not putting a correlation figure on this. Outage and price share too many common causes for a single coefficient to mean anything honest.
What happens next
Expect January to be the peak of the 2026-27 outage year, not November. Three of the last four years have put their heaviest month in the October-to-January band, and 2026 opened at 56.9 GW. If the seasonal shape holds, the fleet's busiest maintenance window lands squarely in that stretch.
The summer discount should hold above 25% next year. It has cleared 18% every year since 2022 and topped 30% in both 2024 and 2025. Something would have to go quite wrong for it to collapse back to the single digits of 2016.
Central-sector outage will most likely stay near or above the state figure. It has been within a few gigawatts either way since 2023, and central capacity is still growing faster. Whether it crosses over on an annual basis depends more on how many days the state fleet has a bad month than on anything the central fleet does.
Eastern and North Eastern will keep drifting against the national trend, though the absolute numbers stay small. Both have gone up in consecutive summers while everything else fell. Between them they still account for only about 15% of national outage, so this is a regional reliability question rather than a national supply one.
Full-year 2026 should land somewhere between 2024 and 2025, probably in the low fifties of gigawatts. The first seven months are tracking below 2025, but the back half of the year is always the heavier half, and the grid has embarrassed forecasters with less provocation than this.
The fleet has essentially taught itself to be tired in November and wide awake in May. Which, if you've ever spent a May in Nagpur, is exactly the right instinct.
All data used in this analysis can be found within the Wattfeed dashboard.