At 15:35 on 21 May 2026, India drew 270.7 GW. Highest single 15-minute block in the seven years of peak-day curves we hold, by a comfortable margin.
Here is the part worth sitting with, though. The quietest moment of that same day — 07:50, when the country was still finding its slippers — was 224.6 GW. That is more electricity than India managed at its absolute busiest on 31 May 2022, which topped out at 204.4 GW.
The floor of 2026 is now above the ceiling of 2022. Four years. That is the whole story in one sentence, and everything below is just elaboration.
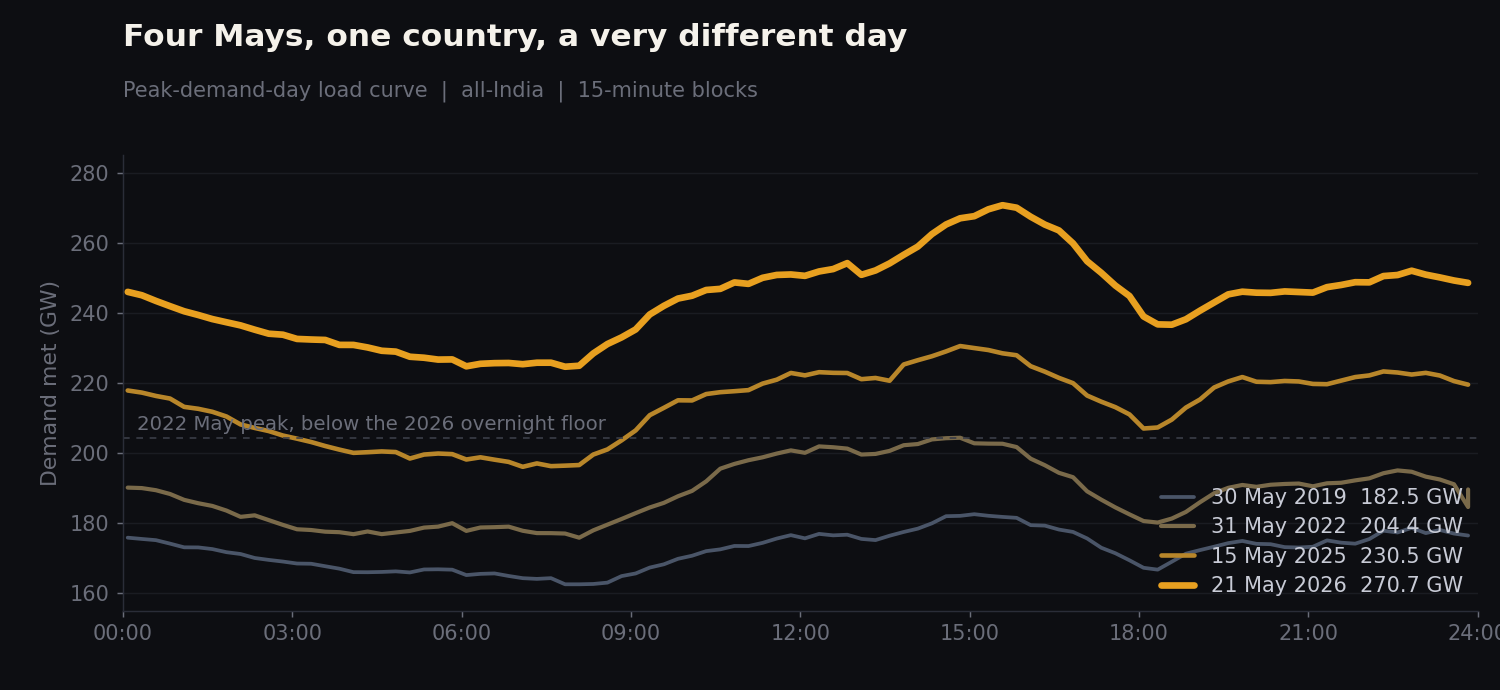 Seven Mays of peak-day load curves. The dashed line is the 2022 May peak, which the 2026 curve never dips below. Source: Wattfeed dashboard.
The afternoon takeover
That 21 May day moved 5,851 MU. One day. In May 2019 the equivalent day managed 4,135.8 MU, so we are up about 41% on daily throughput in seven years, which is the sort of number that makes planners reach for something stronger than filter coffee.
April 2026 had already set the table with 256.1 GW at 15:35 — same clock position, 14.6 GW lower. The two months rhyme almost exactly in shape. Both are broad, flat, high plateaus that start climbing around eight in the morning and refuse to come down until well after dark.
Load factor on the May day: 90.0%. On a summer peak day the Indian grid is essentially running flat out for eighteen hours straight. There is no gentle overnight lull to catch up in. Air conditioners do not observe office hours.
Where the peak used to live
Now for the reference point, and then we will leave 2019 alone.
Back then, the daily peak was an evening creature. Of the eight monthly peak days we hold for 2019, six peaked between 18:00 and 23:00 — 3 July at 21:20, 14 June at 22:35, 19 November at 18:20. It was a lighting-and-fans grid, and it behaved like one. Everyone got home, everything switched on, the curve spiked, and then the country went to bed.
That pattern is essentially extinct.
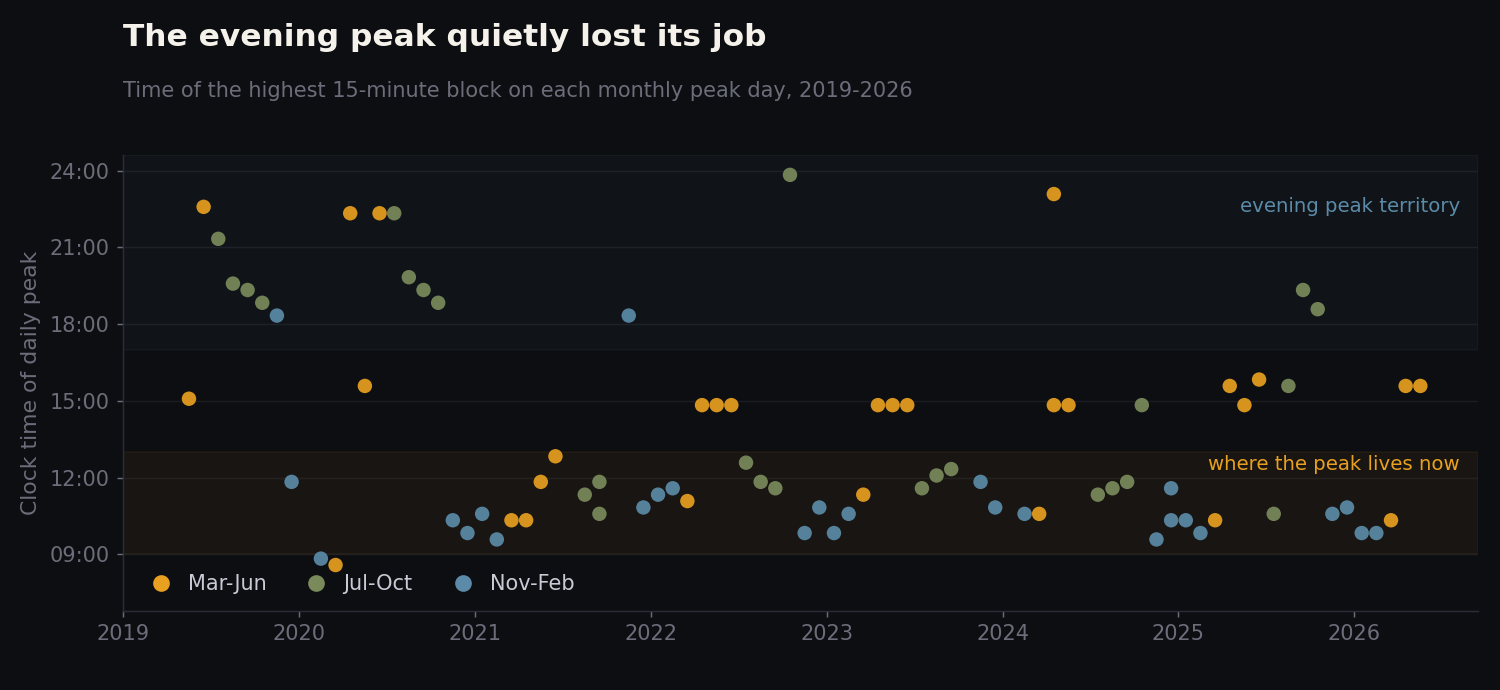 Time of day of the highest 15-minute block on each monthly peak day. Blue is Nov–Feb, amber is Mar–Jun, olive is Jul–Oct. Source: Wattfeed dashboard.
From 2021 onwards the dots migrate up into the daylight and mostly stay there. In 2025 and 2026 the peak lands in the 09:00–13:00 window or the 13:00–17:00 window on nearly every peak day. The evening still shows up occasionally — 24 September 2025 peaked at 19:20, and 16 October 2025 at 18:35 — but as a guest, not a resident.
Two things did this at once. Cooling load, which is a daytime and afternoon phenomenon, has grown faster than everything else. And commercial and industrial demand now runs deep enough into the day that the midday hours are genuinely the busiest, rather than a lull between a morning start and an evening rush.
Winter is a different country
Summer gets the headlines. Winter is where the operational headache actually lives.
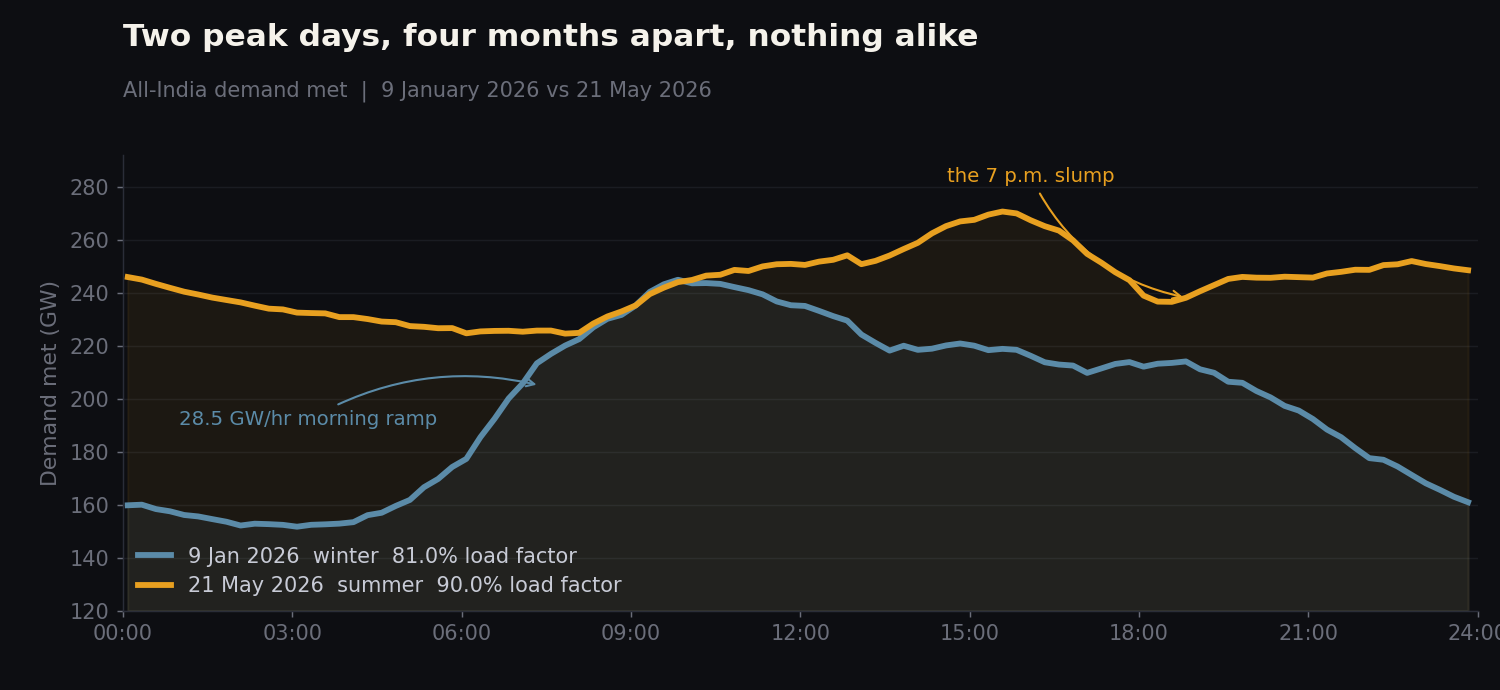 9 January 2026 against 21 May 2026, same axis. One is a wall. The other is a cliff face. Source: Wattfeed dashboard.
On 9 January 2026 the peak was 245.0 GW at 09:50 — not far off May's number. But the trough was 151.7 GW at 03:05. That is a swing of 93.3 GW between the sleepiest and the busiest moment of a single day, and the grid had to find all of it in under seven hours.
The steepest single hour on that day: 28.5 GW/hr, starting at 06:05. That is the fastest ramp anywhere in the seven-year record. Somebody, somewhere, has to have that much generation warmed up and waiting for the country to open its eyes.
Load factor on 9 January was 81.0%, the lowest of any peak day we hold. Its nearest rivals are also recent: 31 December 2025 at 81.6%, 29 January 2025 at 82.2%. Winter days are getting spikier, not flatter. For contrast, the flattest day in the whole record was 5 July 2022 at 96.0% — a monsoon day where the curve barely moved all afternoon.
So the same grid, four months apart, is asked to do two completely different jobs. In May it needs endurance. In January it needs reflexes.
The 7 p.m. slump
One more wrinkle, and it is a new one.
Look closely at the May 2026 curve after the afternoon peak. Demand falls to 238.2 GW by 18:50 — down 32.5 GW from the 15:35 high — and then climbs back up to a secondary peak of 252.0 GW at 22:50. The steepest fall of the day is 15.8 GW/hr starting at 17:05.
An evening dip that sits below both the afternoon peak and the late-night peak is an odd shape for a country that used to peak at dinner time. The most likely reading is a genuine lull between the daytime commercial-and-cooling load winding down and residential evening cooling ramping up in earnest later. Whatever the cause, it is a shape that arrives, leaves, and arrives again within six hours, and it is not something the 2019 curve does at all.
What happens next
Five things worth watching, all of which follow from the curves above rather than from anybody's imagination:
The 270.7 GW record probably will not survive the summer. May 2026 was already 11.7% above the highest block anywhere in 2025. In three of the last five years the annual high landed in June rather than May. Something starting with a 2-8 is not a wild suggestion, though the monsoon has ruined better forecasts than this one.
Winter load factor keeps sliding. It has gone 84.6% to 82.2% to 81.0% across the last three January-ish peak days. If that drift continues, the winter of 2026-27 is looking at something starting with a 7, and the morning ramp problem gets a little worse each year rather than better.
The 30 GW/hr morning ramp is coming. 28.5 GW/hr in January 2026, up from 25.8 the winter before. Assuming the pattern holds, the grid crosses that line within a season or two — and unlike the peak, this is a number that has to be met with things that can start quickly.
The evening peak may stage a comeback in the shoulder months. September and October 2025 both peaked after 18:00. As solar capacity keeps growing, the daytime hours get easier to serve and the post-sunset hours get relatively harder, which pushes the binding constraint back toward evening — precisely where it used to be, for entirely different reasons.
The overnight floor is the quiet story. 224.6 GW at seven in the morning in May. The grid no longer really rests. Whatever gets built next has to be comfortable running all night, not just showing up for the afternoon.
Seven years ago the busiest moment of an Indian day was somebody switching a light on after dinner. Now it is the middle of the afternoon, everyone is indoors avoiding the sun, and the grid is holding a 270 GW plateau like it is nothing.
Give it another seven years. The chart is going to need a bigger y-axis.
All data used in this analysis can be found within the Wattfeed dashboard.