July is supposed to be the month India's grid gets to breathe out.
The rains arrive, the air cools by a few degrees, the air conditioners across the northern plains stop running flat out, and the peak quietly settles a few gigawatts below whatever terrifying number May produced. It has worked that way for over a decade. In 2024 the July peak came in at 90.8% of the pre-monsoon high. In 2025, 90.9%. Reliable, boring, seasonal.
In July 2026, India's peak demand hit 270,209 MW. May 2026, the all-time record month, managed 270,832 MW. The gap between the hottest month of the year and a monsoon month was 623 megawatts, which on a 270 GW system is a rounding error with ambitions.
That is the thing worth sitting with: the monsoon showed up, the rains happened, and the peak barely noticed. Energy demand grew too, but at less than half the rate, and the all-India load factor fell to 83.96%. India is now adding megawatts considerably faster than it is adding megawatt-hours, and July 2026 is where that stopped being a trend line and started being a shape.
July forgot to take its holiday
Set the July peak against the highest peak of that same year's April-to-June run and you get a clean measure of the monsoon discount. For most of the last fourteen years it has sat between 89% and 99%, and since 2022 it has been distinctly generous: July has come in somewhere between 9% and 11% below the pre-monsoon high, every single year.
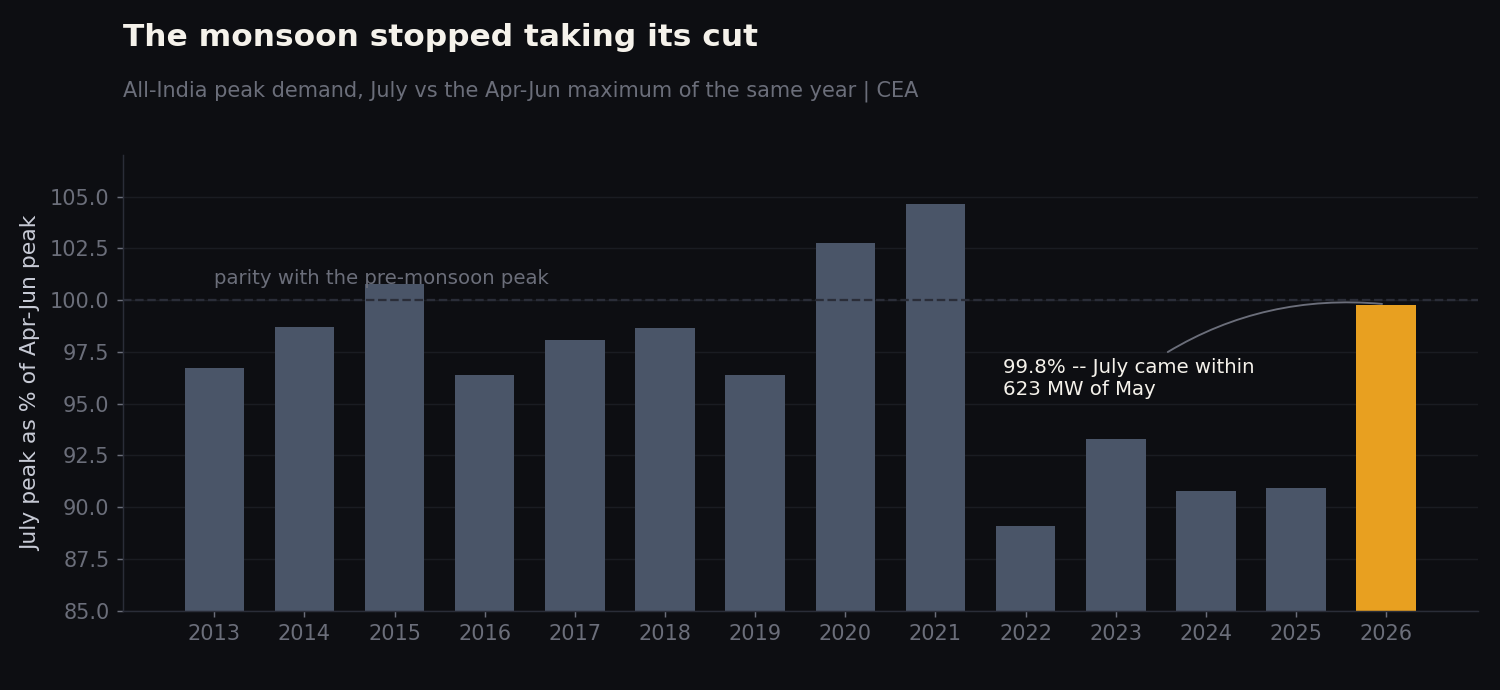 July peak demand as a share of the same calendar year's pre-monsoon (April-June) maximum. Values near 100 mean the monsoon bought the grid no relief at all. Source: CEA, via the Wattfeed dashboard.
This July: 99.8%. The last time the ratio got this close to parity was 2020 and 2021, two years nobody should be drawing seasonal conclusions from. Before that you have to go back to 2015.
CEA's numbers put the July peak met at 270,203 MW against a peak demand of 270,209 MW, which leaves an unmet sliver of 6 MW. Six. On a month where the grid served a quarter of a terawatt at its busiest instant, the shortfall was roughly one mid-sized textile mill having a slow afternoon.
Energy told a much calmer story. July 2026 energy demand came in at 168,971 MU against 153,925 MU a year earlier, up 9.8%. Healthy, in line with the last few years, nothing that would make anyone sit up. Peak, over the same twelve months, went up 22.4%. When two numbers that usually travel together diverge by thirteen percentage points, something structural is going on underneath them.
Thirty-one days without a break
The easy explanation would be a heat spike. One brutal week, one record afternoon, a headline number that doesn't represent the month. The daily data says otherwise.
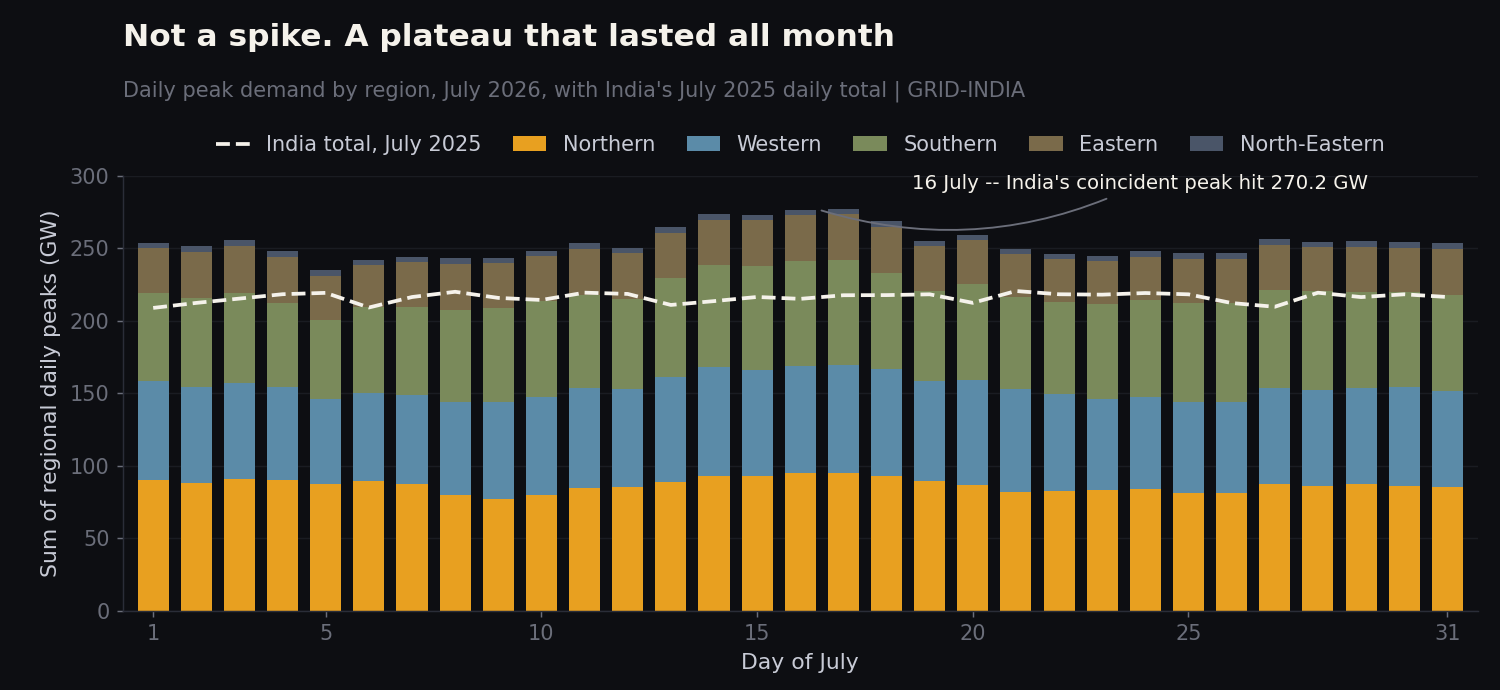 Daily regional peaks stacked for July 2026, against India's coincident daily peak through July 2025 (dashed). The stacked height exceeds India's coincident peak because regions do not all peak at the same instant. Source: GRID-INDIA daily demand, via the Wattfeed dashboard.
Every one of the 31 days in July 2026 came in above the single highest day of July 2025. Not the average. The highest. The quietest day of this July, all-India, was 225,600 MW, comfortably above anything the grid saw in the whole of last July. Four of the ten largest daily peaks in the entire 2018-onwards daily record landed inside this one month.
The three biggest of them, 14 to 17 July, form a plateau rather than a spike. Demand went up, stayed up for the better part of a week, and came down to a level that would have been a record two summers ago.
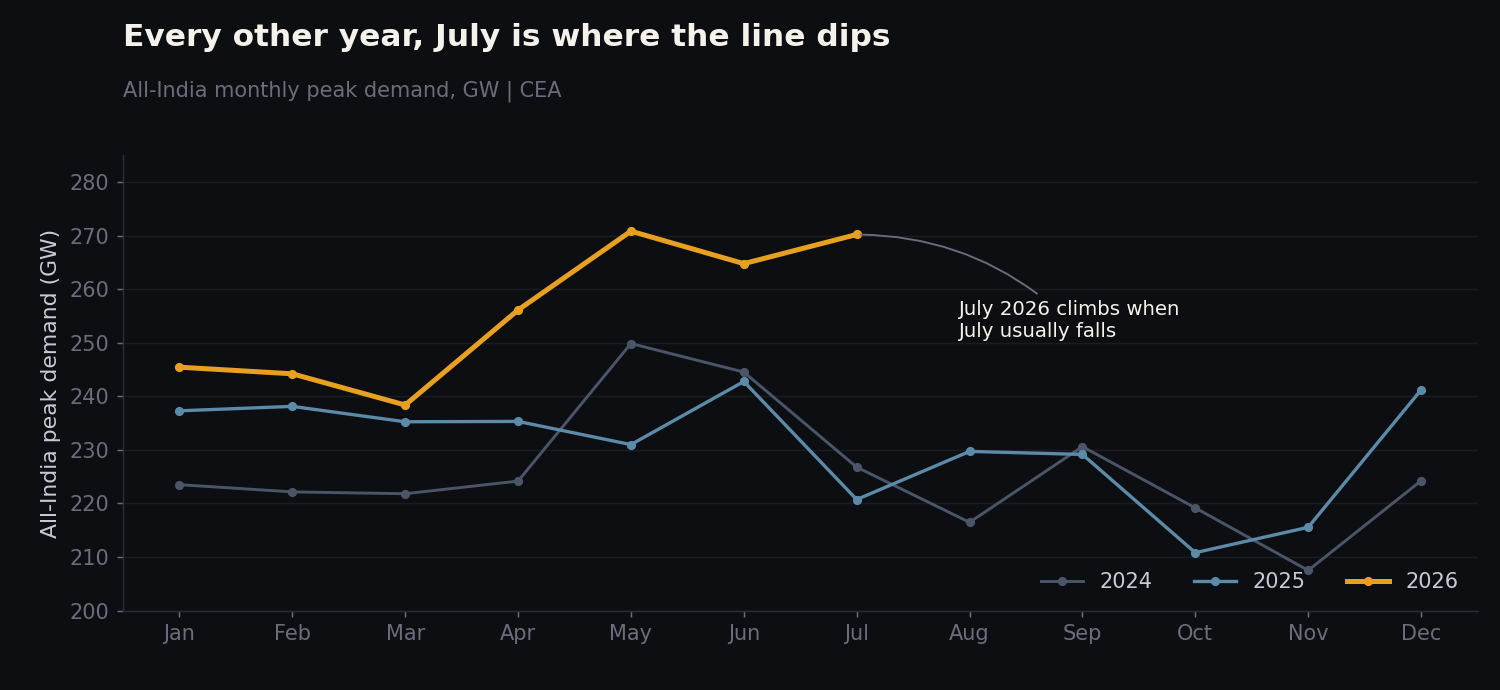 All-India monthly peak demand. In 2024 and 2025 the line falls away after June. In 2026 it turns back up. Source: CEA, via the Wattfeed dashboard.
Put three years side by side and the shape is unmistakable. In 2024 and 2025, June is a local high and July is the dip on the far side of it. In 2026, June dips and July climbs back past it. The seasonal notch has inverted.
Across the wider fiscal year so far, April to July 2026 delivered 651,095 MU of energy demand against 599,122 MU in the same four months of FY 2025-26, up 8.7%. The energy side of the system is growing at a perfectly recognisable rate. It is the peak that has gone rogue.
Three regions, one bad week
Here is the arithmetic that took some untangling. India's July peak grew 22.4% year on year. Not one region grew anywhere near that fast. Northern managed +16.5% (81,583 MW to 95,048 MW), Western +14.3%, Southern +13.1%. Eastern actually shrank, by 2.9%. North-Eastern moved 18 MW, which at 4.1 GW is the regional equivalent of shifting in your chair.
So where did the extra come from? Timing.
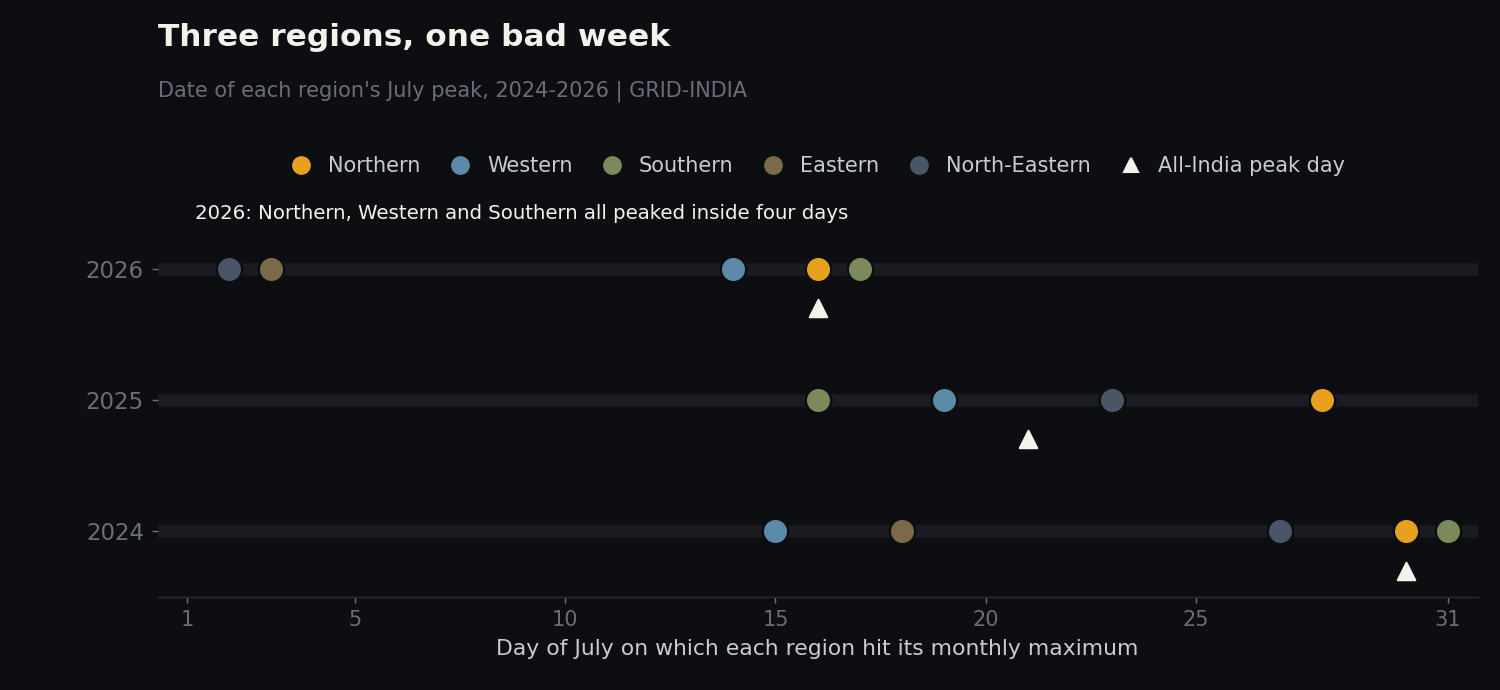 The calendar day each region recorded its July maximum. In 2026 the three largest regions land inside four days of each other. Source: GRID-INDIA daily demand, via the Wattfeed dashboard.
In July 2025, the regional peaks were scattered across a fortnight. Southern peaked on the 16th, Western on the 19th, Eastern and North-Eastern on the 23rd, Northern not until the 28th. The regions took turns. Add up those five separate monthly maxima and you get 1.123 times India's actual coincident peak, which is a polite way of saying that a good slice of the country's demand was obligingly happening when the rest of it wasn't.
In July 2026, Western peaked on the 14th, Northern on the 16th, Southern on the 17th. Three of the four biggest regional systems in the country hit their monthly high inside four days, and the same sum comes to just 1.035 times the coincident peak. The stagger collapsed.
This is the mechanism. India's regional diversity has quietly been one of the grid's best free assets, worth tens of gigawatts of notional capacity simply because Chennai and Chandigarh do not get hot on the same afternoon. In the middle of July 2026, for a few days, they did.
The load factor picks up the tab
If the peak runs ahead of the energy, the load factor has to give. It duly did.
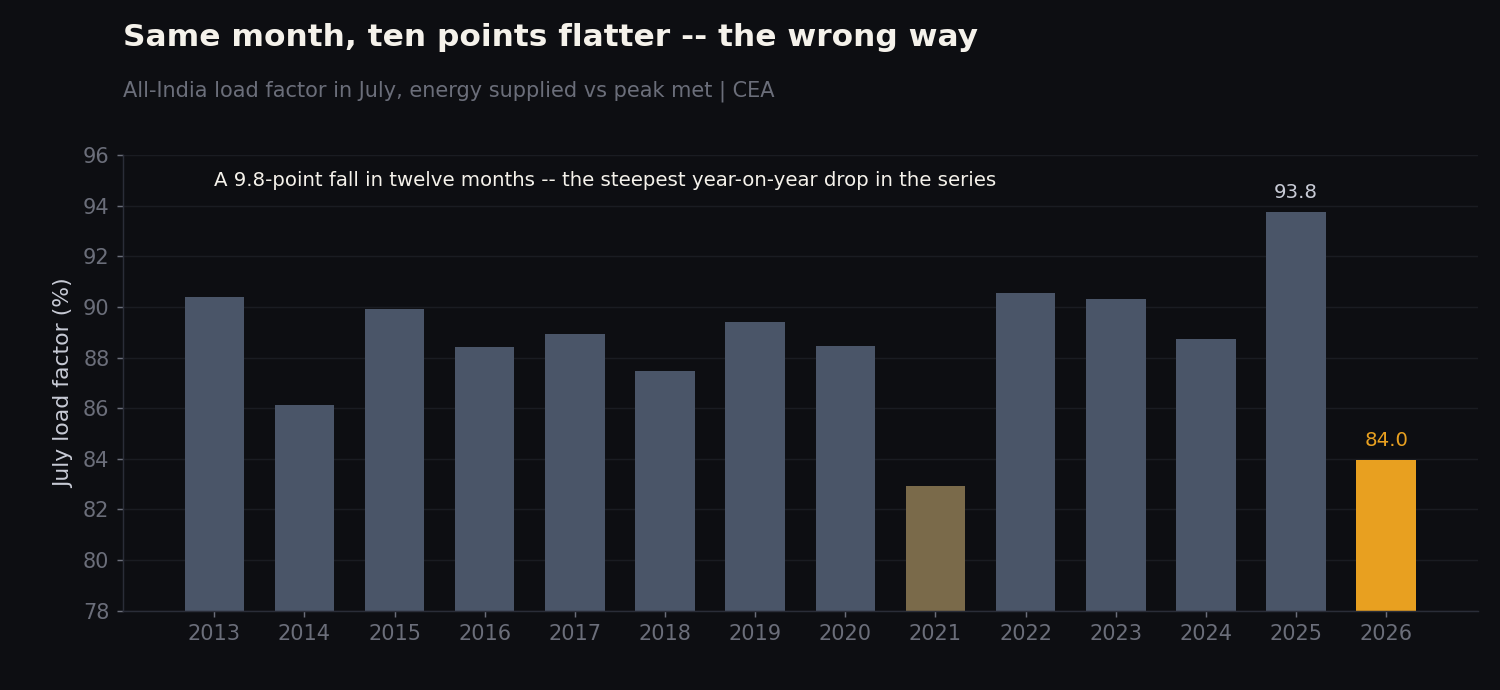 July load factor, energy supplied against peak met. July 2025 was the highest reading in the series. July 2026 is the second lowest. Source: CEA, via the Wattfeed dashboard.
83.96%, against 93.77% in July 2025. That is a fall of 9.8 percentage points in twelve months, the steepest year-on-year move anywhere in the fourteen-year series, and it leaves July 2026 as the second-flattest July on record behind only the deeply unrepresentative July of 2021.
Some of that is mean reversion. July 2025 was an outlier at the top, a wet, mild month where demand sat unusually flat and the load factor had nowhere to go but up. But even setting 2025 aside, 83.96% is below every July from 2013 to 2020, and comfortably below the 88-90% band the monsoon months normally occupy.
Regionally the damage is uneven. Western fell from 89.94% to 83.08% and Northern from 85.60% to 81.47%. Eastern went the other way entirely, climbing from 78.24% to 85.94%, which fits a region whose peak fell while its energy held up. Southern barely moved, 77.10% to 77.79%, and was already the flattest big region in the country.
A load factor in the low eighties means more plant running for fewer hours, more capacity sitting idle between the shoulders of the day, and a system whose economics depend increasingly on what happens in a narrow window of the afternoon. Which brings us to where that window has moved.
The peak moved house
The 15-minute load curve for each month's highest-demand day is where the shape of all this becomes visible, and it has been drifting for years.
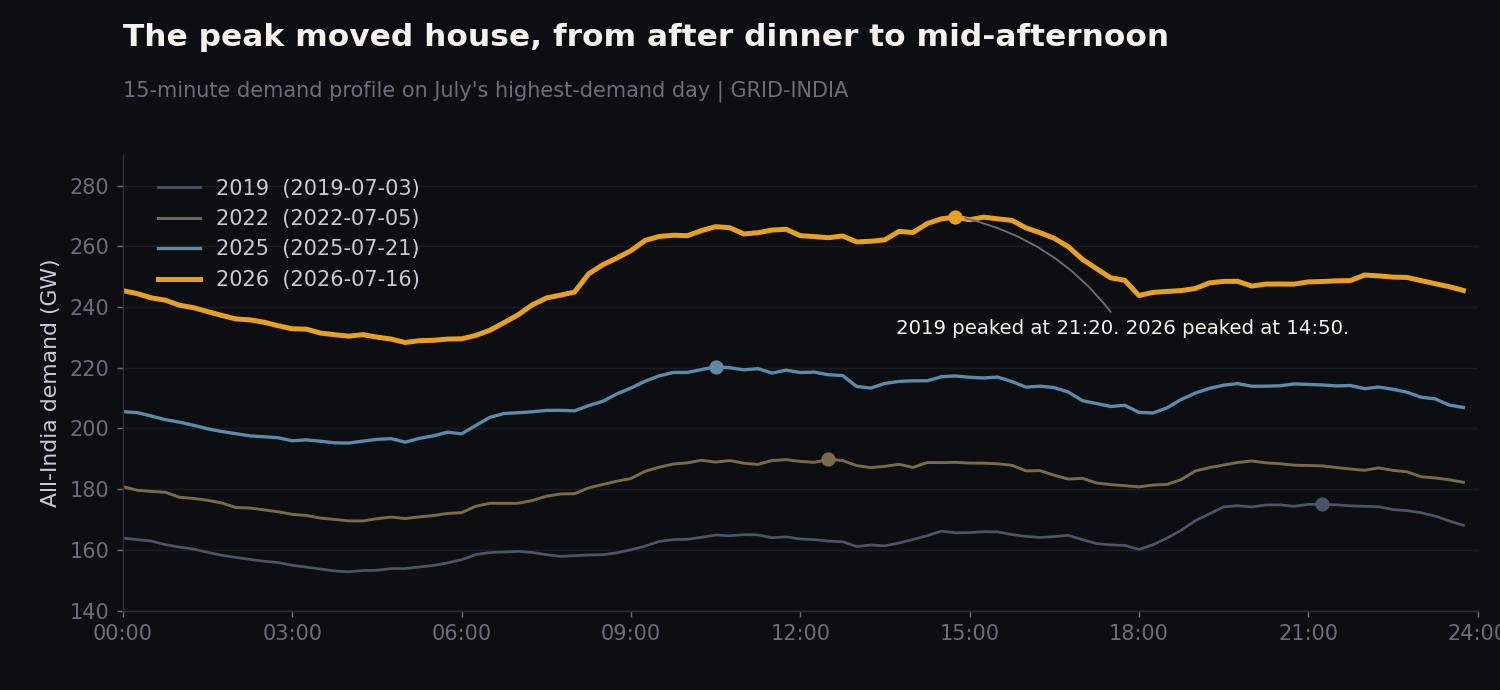 All-India 15-minute demand on the highest-demand day of July, four selected years. Source: GRID-INDIA load curves, via the Wattfeed dashboard.
On 3 July 2019, India's peak day topped out at 21:20. Evening, lights on, dinner underway, the classic shape of a system built around households. On 21 July 2025, the high came at 10:35 in the morning. On 16 July 2026, it arrived at 14:50, in the flat glare of the afternoon, and the evening at 19:00 to 22:00 sat about 16.7 GW below the afternoon high on that same day.
The evening peak has not disappeared. It has simply been outgrown. The afternoon is now where the system is stretched, and the 2026 curve makes the point without needing a caption: it is broad, high and flat from about 09:00 to 17:00, then steps down and holds.
The ramp tells the same story with more violence. On the July peak day of 2025, the gap from the 04:05 trough to the 10:35 high was 25,119 MW. On 16 July 2026, the gap from 05:05 to 14:50 was 41,279 MW. Two-thirds more swing, on a system only a fifth larger. Every megawatt of that has to be started, ramped and paid for.
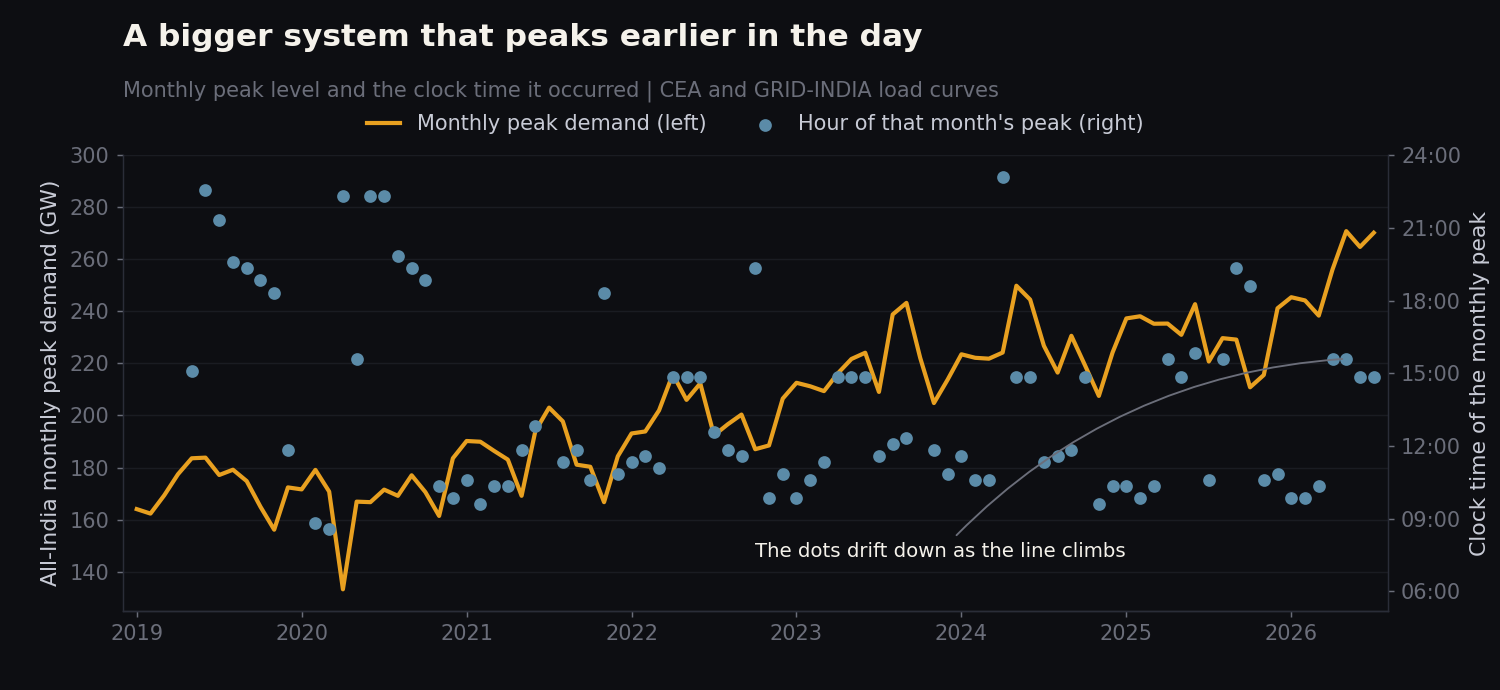 Monthly peak level (left, CEA) against the clock time of that month's peak on its highest-demand day (right, GRID-INDIA load curves). As the line climbs, the dots migrate down the clock.
Stack the two sources together and the relationship is hard to unsee. In 2019 and 2020 the dots cluster in the 21:00 to 23:00 band. By 2023 they have slid to late morning. Through 2025 and 2026 they sit stubbornly between 09:00 and 15:00, with the most recent months bunched around mid-afternoon. The system got bigger and its busiest hour got earlier, and the two things happened together.
The states that went the other way
Peak and energy growth are usually close cousins at the state level. Plot one against the other for July and you would expect a fairly tidy diagonal.
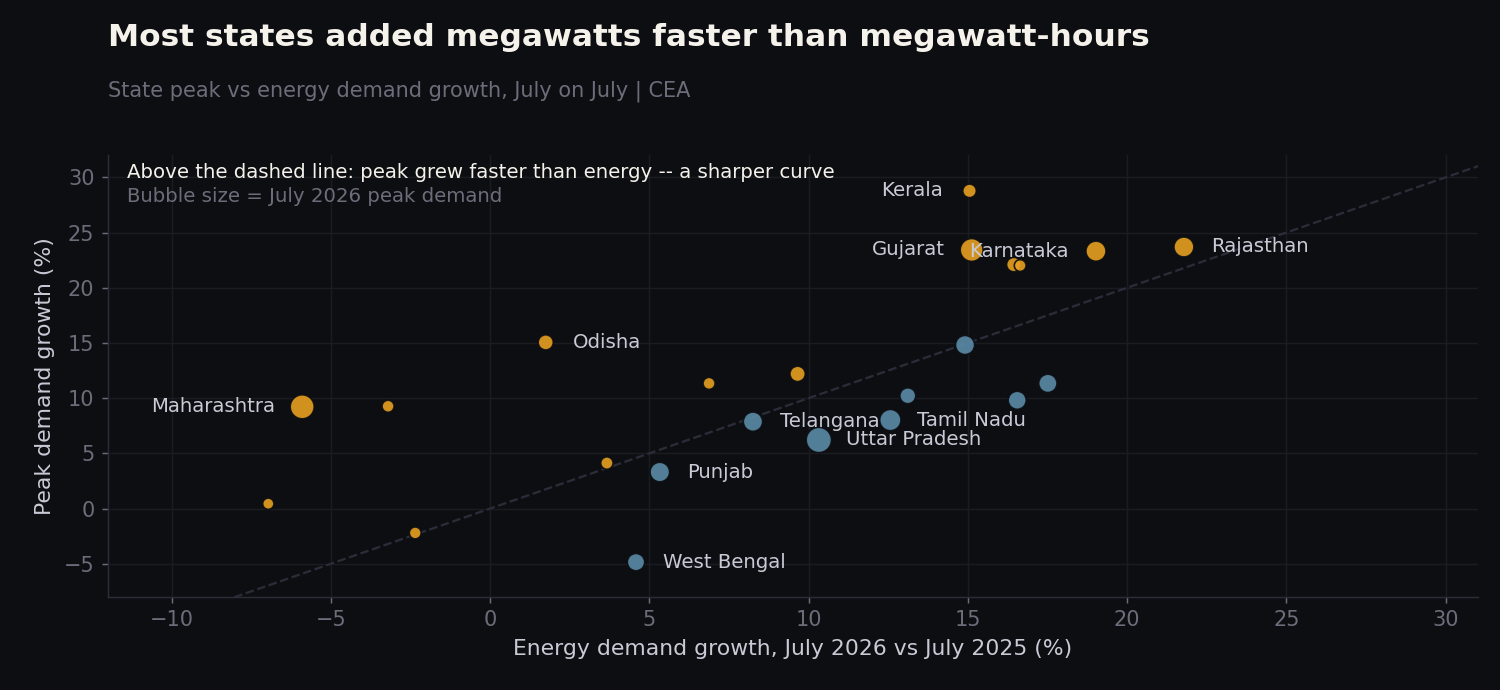 Each bubble is a state, sized by its July 2026 peak. Points above the dashed line added peak faster than energy. Source: CEA, via the Wattfeed dashboard.
Fourteen of the twenty-three states large enough to be worth plotting sit above the line. Kerala tops the list on peak growth at +28.8% against +15.1% on energy. Gujarat added 23.4% on peak and 15.1% on energy. Rajasthan and Karnataka both grew hard on both counts, which is the honest kind of growth.
Maharashtra is the one that stops you. Its July peak rose 9.2%, from 26,426 MW to 28,861 MW. Its energy demand over the same month fell 5.9%. More stress at the top, less work done overall. Odisha did a milder version of the same trick, peak up 15.0% on energy up 1.7%. West Bengal did the reverse, peak down 4.9% while energy grew 4.6%, which is the single tidiest data point behind Eastern region's contrarian month.
And the cost of all this, on the ground, was almost nothing. All-India energy shortage for July 2026 was 192 MU, or 0.11% of demand. That is higher than last July's exceptionally clean 38 MU, and well below July 2024's 378 MU. It is concentrated in a handful of states: Punjab 67 MU (0.67% of its demand), Haryana 54 MU (0.59%), then a long tail of single-digit numbers. A grid that absorbed a 22% jump in peak and gave back one part in nine hundred has, by any reasonable standard, done its job.
What happens next
- The monsoon discount is probably not coming back in full. If the last three summers are any guide, cooling load is now deep enough in the July base that rain shifts it by a few gigawatts rather than a few tens. Expect July 2027 to land somewhere north of 95% of its own pre-monsoon peak, unless the rains are genuinely exceptional.
- The all-India peak should clear 285 GW in the 2027 pre-monsoon window. May 2026 set 270,832 MW after May 2025's 230,993 MW. Even a materially slower year of growth puts next May in the mid-280s, and the record will almost certainly be set between April and June rather than in the monsoon.
- Load factor has further to fall before it stabilises. The annual figure has been sliding for three years and the July reading just fell off a shelf. Somewhere in the high seventies is where this kind of afternoon-weighted curve tends to settle, and India looks to be heading there over the next two or three years rather than the next two or three months.
- Regional diversity is worth less than the planning assumptions say. One month is not a trend, and July 2025's 1.123 ratio may yet prove closer to normal than this year's 1.035. But if synchronised heat events become routine, the free capacity that regional stagger has been quietly providing shrinks, and the reserve margin looks thinner than it does on paper.
- The afternoon ramp is the number to watch, not the peak. A 41 GW swing between the small hours and mid-afternoon is a flexibility problem long before it is a capacity problem. If it grows at anything like this year's rate, the conversation about storage stops being about evening cover and starts being about getting through lunch.
The grid has embarrassed forecasters before, and July has a long history of doing whatever it likes. But for the first time in the record, the month that was supposed to give everyone a breather turned up, looked at May's number, and very nearly matched it.
The monsoon came. The peak simply didn't care.
All data used in this analysis can be found within the Wattfeed dashboard.