In July 2026 India met a peak demand of 270,203 MW. That is 600 MW short of the all-time high set two months earlier, and it happened in the middle of the monsoon.
The same month moved 168,779 million units of energy, which is the heaviest month CEA has ever recorded.
July isn't supposed to do this. July is when the rain arrives, the air cools, and the peak demand line takes a breather before autumn. It has done that every year for a decade. This year it simply didn't.
The monsoon dip went missing
The two cards on the Demand page plot month-of-year along the bottom and lay one line per year on top of each other, so a decade of seasonality stacks up as a family of parallel humps. Peak demand in MW on one, energy met in MU on the other.
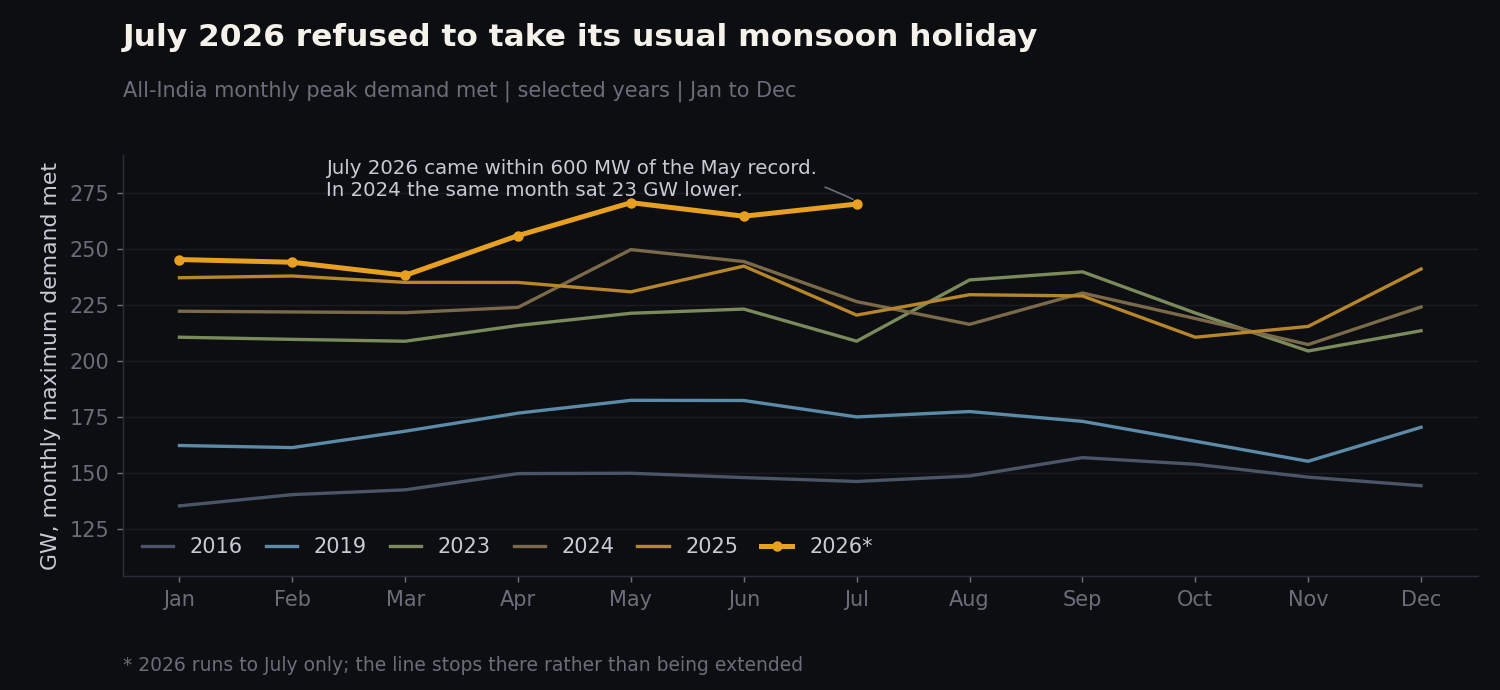 All-India monthly peak demand met, January to December, for six selected years. Rebuilt from the dashboard card with two changes: values shown in GW rather than MW, and the year set trimmed to six for legibility. Source: Wattfeed dashboard.
Look at the shape of the humps and the story is right there. Every line rises into May or June, dips through July, and comes back for a second bump in August and September. Textbook Indian seasonality: brutal pre-monsoon heat, then relief, then the sticky post-monsoon stretch.
Now find the 2026 line. It goes up and it stays up.
The cleanest way to measure it is July against May in the same year. In 2016 July sat 2.5% below May. In 2019, 4.1% below. In 2024 the gap was a yawning 9.3%, some 23 GW. In 2026 it was 0.2%. The dip has essentially closed.
The energy card tells the same story with less drama, because energy was always steadier than peak.
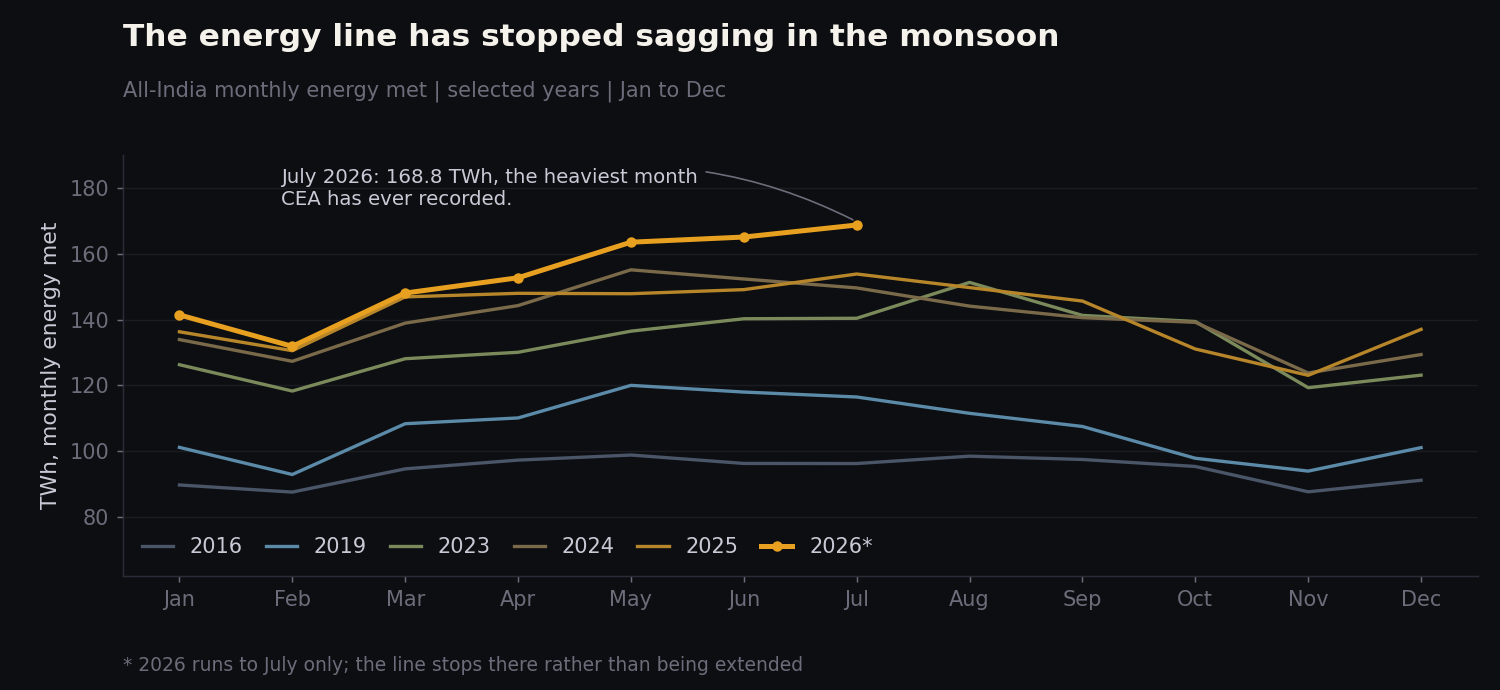 All-India monthly energy met, January to December, same six years. Shown in TWh rather than the card's MU, and the same six-year selection. Source: Wattfeed dashboard.
There, July has gone from being roughly level with May to clearly above it. July 2026 at 168.8 TWh beat May by 5.2 TWh, in a month that in 2019 came in 3.5 TWh below May.
The floor rose faster than the ceiling
Index each year's monthly peaks against that year's own average and the pre-COVID and post-COVID shapes separate cleanly. Averaging 2016 to 2019 against 2023 to 2025, the biggest change isn't in the summer at all.
It's January. Pre-COVID, January ran at 94.3% of the year's average peak. Now it runs at 99.4%. February moved from 95.4 to 99.3. The winter trough, which used to be a real trough, has mostly filled in.
Meanwhile October fell from 101.5 to 96.7 and November from 96.5 to 93.1. The post-monsoon second bump, which was once nearly as important as the pre-monsoon one, has flattened out. And June strengthened, from 102.4 to 105.3, while July weakened from 100.9 to 97.3, which is the pattern the 2026 line has just broken.
So the curve hasn't simply grown. It has been redistributed. The single summer spike got sharper and moved earlier, the autumn echo faded, and the winter floor came up several points. A grid that used to have two busy seasons and two quiet ones now has one very busy season and no genuinely quiet one.
The annual peak month makes the same point in one line. In 2016 it was September, in 2017 August, in 2018 September. Since 2022 it has landed in May or June four times out of five. The heat is still in charge, it just arrives before the rain now rather than after it.
Twelve states, twelve different Julys
Here's the part the national card can't show you, and it's the most interesting thing in the dataset. That smooth national hump is an average of states whose peaks happen in completely different months.
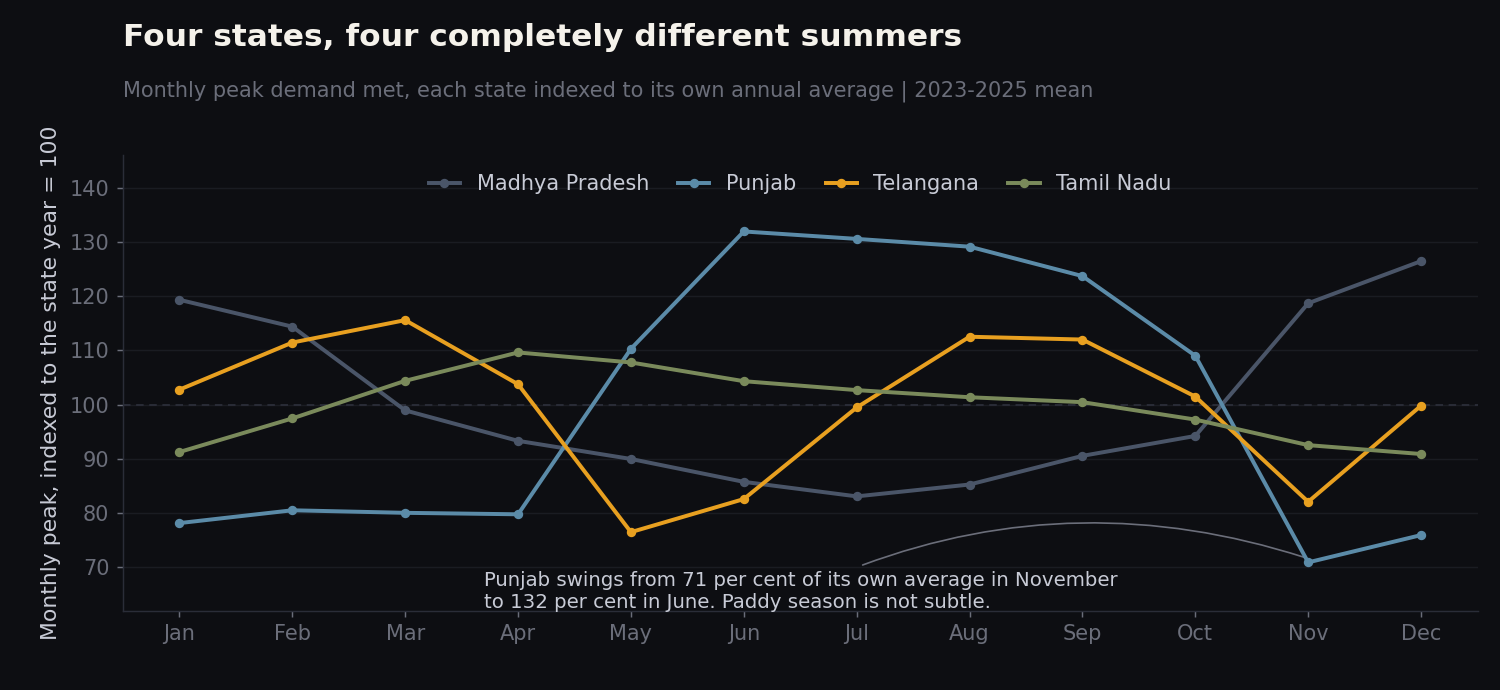 Monthly peak demand met for four states, each indexed to its own annual average across 2023 to 2025. The dashboard card shows one geography at a time; this puts four side by side. Source: Wattfeed dashboard.
Madhya Pradesh peaks in December, at 126.5% of its own annual average, and bottoms out in July at 83.1%. It is a winter-peaking state in a summer-peaking country, because rabi-season irrigation pumping doesn't care what the thermometer says.
Punjab is the mirror image and the most violent swing of the four: 131.9% in June against 70.9% in November. Paddy season is not subtle.
Telangana has done something stranger. Pre-COVID it peaked in September or August, every year without fail. Post-COVID it peaks in March, every year without fail. A four-to-six month shift in the space of a few years, which is a bigger change than anything visible in the national line.
Tamil Nadu, by contrast, barely moves at all: April at 109.6% down to December at 90.9%, a range of under 19 points where Punjab covers 61. If you wanted one state that behaves like a well-mannered European load curve, that's it.
The price line stopped listening
If demand keeps setting records, the market ought to notice. It hasn't.
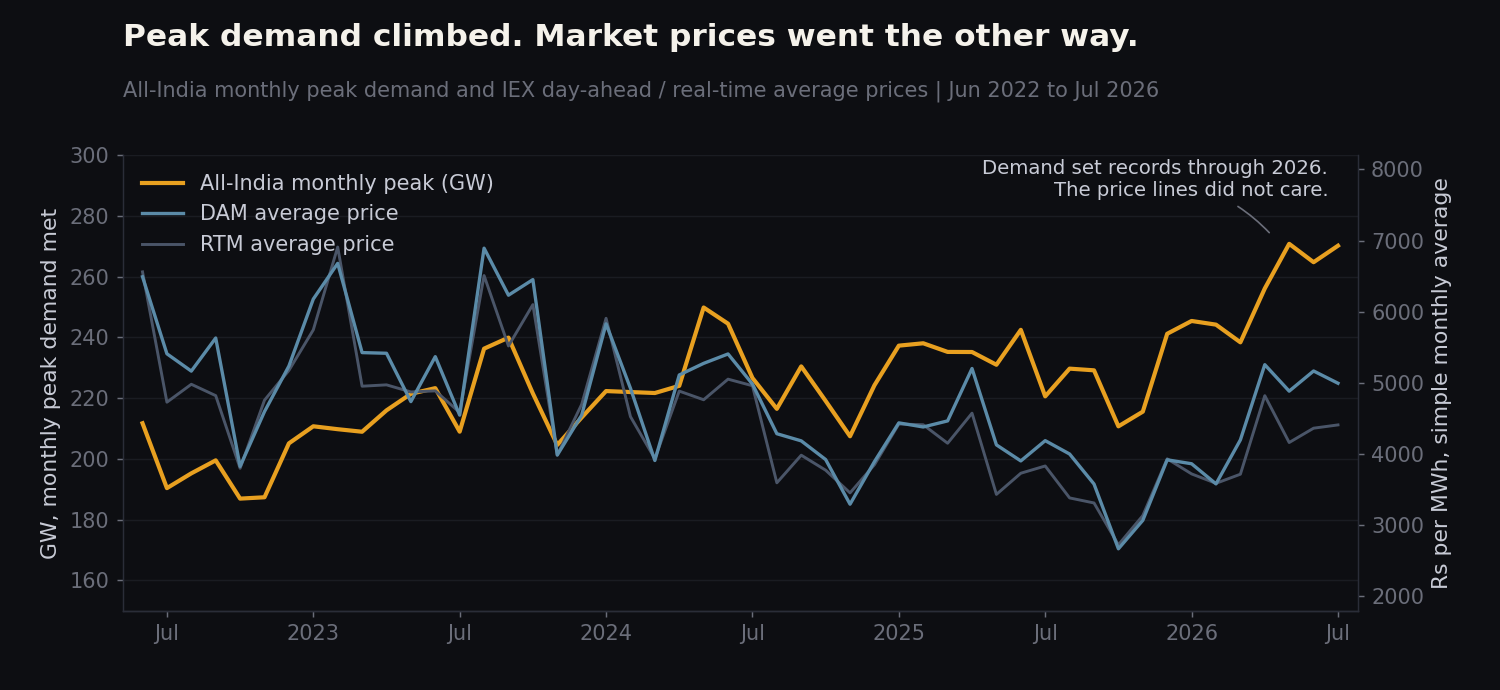 All-India monthly peak demand met on the left axis, IEX day-ahead and real-time simple monthly average prices on the right. A second dataset, added here rather than shown on the dashboard card. Source: Wattfeed dashboard.
Across the 50 months where both series exist, the relationship between monthly peak demand and the day-ahead average price is essentially nil. Not weak. Nil. Mean peak demand rose from 217.9 GW in 2023 to 255.7 GW across the first seven months of 2026, up about 17%, while the day-ahead average fell from ₹5,539 to ₹4,565 per MWh, down about 18%.
The single starkest pair: August 2023 peaked at 236.3 GW and cleared at ₹6,894, the dearest month in the series. July 2026 peaked 34 GW higher and cleared at ₹4,996.
And in none of 2023, 2024, 2025 or 2026 did the year's peak-demand month also produce the year's dearest power. The answer is on the supply side rather than the demand side, which is a different chart and a different article.
One honest limit: the exchange price series only begins in June 2022, so there is no pre-COVID price comparison available here at all. That half of the question can't be answered from this data.
What happens next
Expect July 2027 to sit within 3% of that year's May peak, not 9% below it. The gap has narrowed in each of the last two years and closed almost entirely this one. Two data points is not a trend, but the direction is consistent with the rising winter floor as well.
January should cross 100% of its own year's average peak within two or three years. It has climbed from 94.3 to 99.4 points between the pre-COVID and post-COVID windows, and January 2026 already came in at 245.4 GW, higher than every single month before May 2024.
The all-India annual peak will keep landing in May or June rather than August or September. It has done so in four of the last five years, and the state-level shifts are pushing the same way.
Watch Telangana's March. A state that relocated its annual peak by five months in half a decade is not finished moving, and March is not a month the rest of the grid is braced for.
The autumn bump will keep fading, assuming the last three years are any guide. October is already nearly five points down on its pre-COVID share of the year, which makes it the quiet season the grid used to find in the monsoon.
July has traditionally been the month the Indian grid gets to exhale. Somebody appears to have cancelled that.
All data used in this analysis can be found within the Wattfeed dashboard.