At 12:15 on 17 July 2026, India's grid-connected batteries were pulling 5,814 MW off the network. Not delivering. Pulling.
The night before, the same fleet had been pushing 4,920 MW the other way.
Neither number existed a year ago. GRID-INDIA's 15-minute dispatch tables carried no storage column at all until May 2026, and the charging side only turned up on 1 June. So this is the first honest look at what India's battery fleet actually does with its day, and the answer turns out to be: precisely what you would hope, with the punctuality of a bank clerk.
The battery keeps office hours
Average every day of July 2026 together and the shape is almost comically tidy. Charging starts around 07:00, builds through the morning, and tops out at roughly 4.4 GW just after noon. Then it stops. By 17:00 it is a rounding error. Discharge picks up from about 18:30, crosses 2 GW by 19:30, and peaks near 3.6 GW between 22:00 and 23:00 before tailing off past midnight.
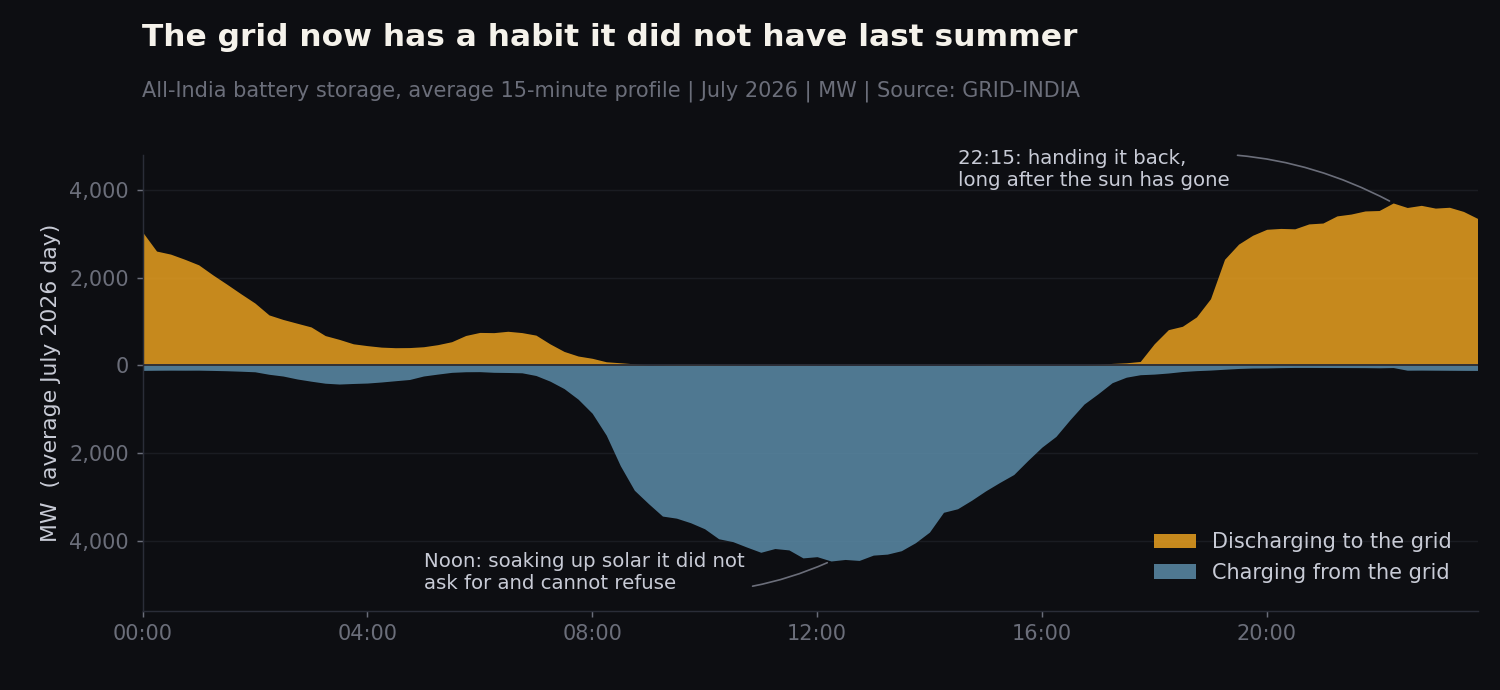 Charging (below the line) clusters tightly around midday; discharging (above it) runs from the evening ramp until well past midnight. Source: Wattfeed dashboard.
Over the month that came to 1,008 MU drawn in and 799 MU sent back out. June ran 909 in and 754 out. Put the two full months together and the fleet returned about 81 per cent of what it took, which is roughly what lithium cells plus inverters plus a transformer will give you once everything has taken its cut.
The energy itself is still small. Those 799 MU are less than half a per cent of July's 171,525 MU of total generation. But energy is the wrong yardstick for storage. What matters is when, and on that measure the battery has walked straight into the single most valuable eight hours of the Indian day.
A 67 GW hole to arbitrage
Net demand is total demand minus whatever wind and solar happen to be producing. It is the load that everything else has to cover, and it is the number that tells you how hard the dispatchable fleet is working.
On the average July 2026 day, net demand bottomed out at 146.6 GW around one in the afternoon and peaked at 213.2 GW at half past ten at night. That is a 66.6 GW gap inside a single day. In July 2025 the same gap was 53 GW. The hole got 13 GW deeper in twelve months, and it did so almost entirely because of solar: midday solar output averaged 61.7 GW this July against 47.0 GW last July. The instantaneous record now stands at 82,402 MW, set at 12:15 on 27 March 2026.
There is a lovely side effect buried in the demand series. India's all-time peak demand block, 270,820 MW, landed at 15:45 on 21 May 2026. Mid-afternoon. The evening peak still exists, but the biggest raw number on the grid has quietly migrated into the middle of the working day, where it can be met by sunshine.
Back in early 2025 this curve was a gentler animal: a shallower belly, a steeper but shorter ramp. Now the grid spends its lunch hour swimming in sunshine and its dinner hour scrambling.
Coal took the job nobody wanted
Somebody has to fill that hole from the bottom, and it is not the batteries. Not yet.
On the average July 2026 day, thermal generation sat at 116.4 GW at its midday minimum and 169.7 GW at its late-evening maximum. A 53 GW swing, every single day, from a fleet that was designed and financed on the assumption that it would run flat. In July 2025 that swing was 40 GW. Coal has picked up an extra 13 GW of daily cycling in one year without anyone throwing it a party.
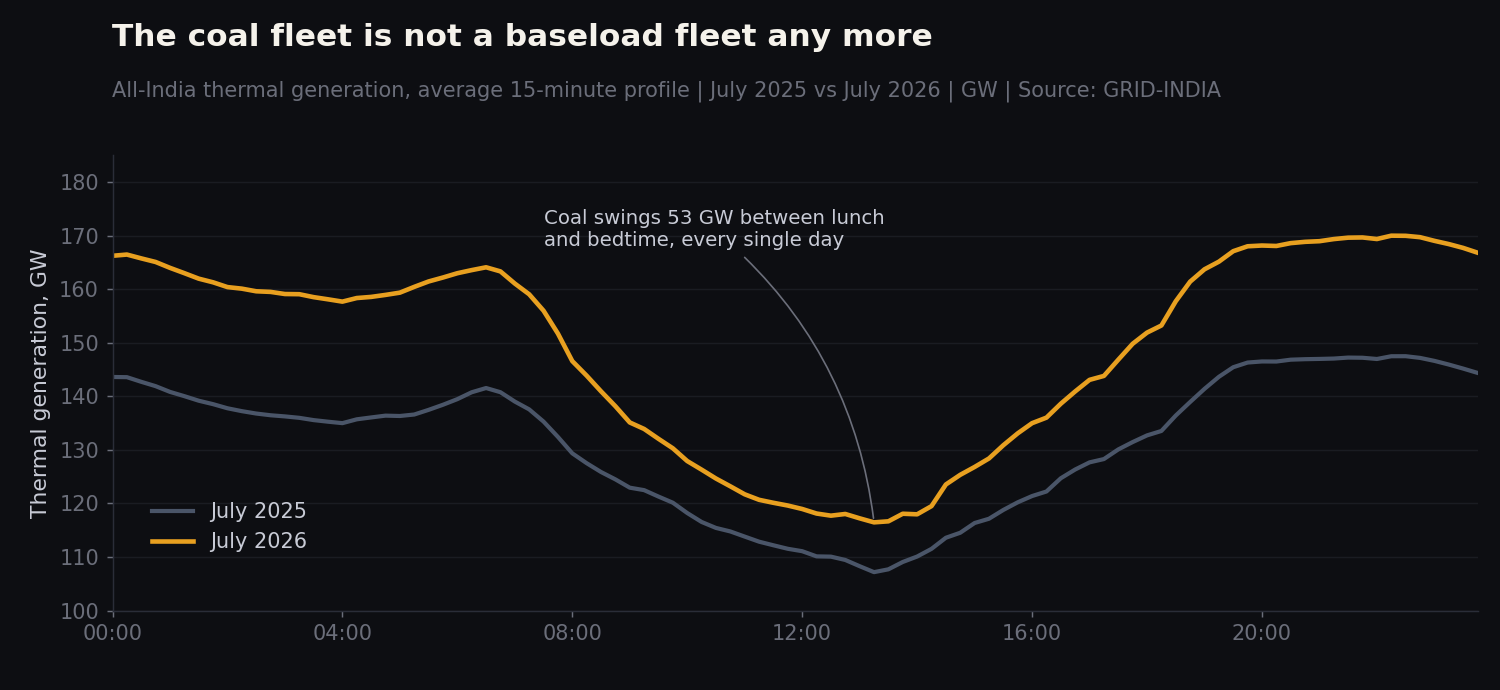 The 2026 curve sits higher everywhere, but the midday dip is what matters: coal now backs down for solar and comes roaring back for dinner. Source: Wattfeed dashboard.
Individual days are wilder than the average. On 22 June 2026 thermal output fell to 103.6 GW at 13:30 and climbed to 186.4 GW by 22:30. That is 82.8 GW of coal turned up in nine hours, which is more installed capacity than most countries own.
Gas, meanwhile, is doing the opposite of what a fuel usually does when it becomes useful. Its energy contribution is falling: daily average gas generation over January to July was down 17.7 per cent against the same stretch of 2025, and it made up just 1.1 per cent of July's generation. But its shape has sharpened. On the average July day gas idles at 1,973 MW through the middle of the day and doubles to 4,241 MW by ten at night, and it hit 10,157 MW at midnight on 17 July. Gas is no longer a source. It is a fire extinguisher.
Nuclear has noticed none of this. Across the average July 2026 day it moved between 6,554 MW and 6,661 MW, a variation of about 1.6 per cent over twenty-four hours. Daily output is up 11.4 per cent year on year and the fleet set a record of 7,356 MW on 4 April 2026. It simply declines to have opinions about the time of day.
The frequency has got twitchier
Indian grid code wants frequency inside 49.90 to 50.05 Hz. In July 2025, 78.3 per cent of 15-minute blocks sat in that band. In July 2026 it was 75.8 per cent, and time spent below 49.90 Hz rose from 5.6 to 7.4 per cent. Not alarming. Not nothing either.
Split it by hour and the culprit is obvious.
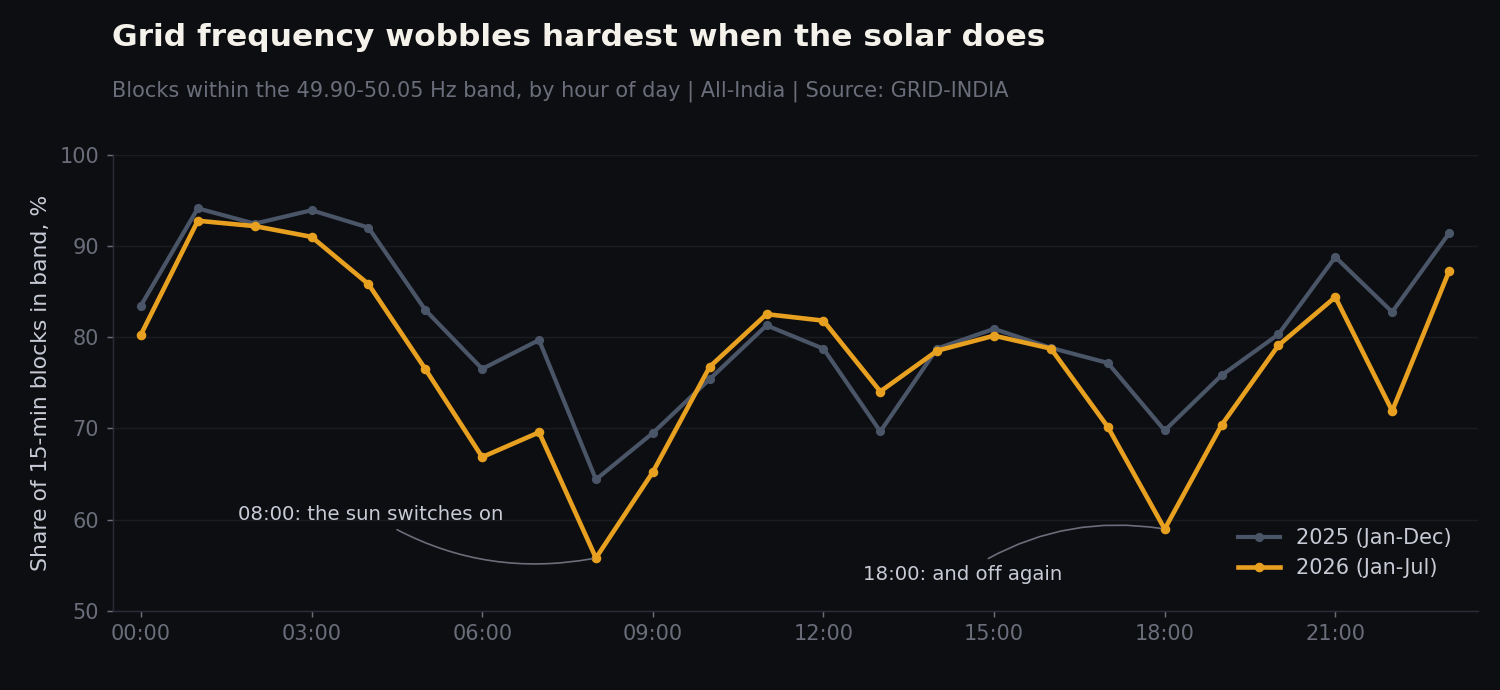 Two deep notches, at 08:00 and 18:00, exactly when solar is switching on and off. Both got worse in 2026. Source: Wattfeed dashboard.
At two in the morning, 92 per cent of blocks are in band. At eight in the morning, 55.8 per cent. At six in the evening, 59.0 per cent. Those are the two hours when tens of gigawatts of solar arrive or leave, and both have degraded from 2025, when the same hours managed 64.4 and 69.8 per cent.
Which brings us to the awkward part. The battery fleet's discharge peaks at 22:00, comfortably after the evening ramp is over. At 18:00, the worst-behaved hour of the day, it is averaging 829 MW, roughly a fifth of what it delivers four hours later. The batteries are chasing the deepest part of the evening load, which is entirely rational, and leaving the messiest part of it alone.
What happens next
Charging energy went from 909 MU in June to 1,008 MU in July, an 11 per cent jump in a single month. Two months is not a trend, but if even half that pace survives the year, the fleet will be moving well over 2,000 MU a month by mid-2027.
Expect the discharge window to creep earlier. Right now it peaks at ten at night; the value, and the grid's actual distress, sits at six. The moment dispatch or ancillary signals reward that hour properly, the curve should slide left by two or three hours. That one is falsifiable and worth watching.
Coal's daily swing has widened by 13 GW in a year. If solar keeps adding capacity at anything like its recent pace, another 8 to 12 GW of daily cycling by next summer looks likely, and the wear-and-tear conversation the sector keeps postponing will arrive whether or not anyone schedules it.
Frequency in-band share has now slipped in each of the last several summer months. Unless storage or fast reserves start showing up at the ramp specifically, a summer month below 75 per cent in 2027 would not be a surprise. The grid has embarrassed forecasters before, so treat that as a direction rather than a date.
And gas will almost certainly keep shrinking as an energy source while getting spikier as a peaker. It has spent a decade being described as a bridge fuel. It has quietly become a doorstop, and a rather well-paid one.
The nicest thing here is how ordinary the battery curve already looks. Three months ago it was a column of blanks. Now it charges at noon, sells at ten, and gets four units back for every five it borrows, without drama and without a press release. That is what infrastructure looks like once it stops being a pilot project.
All data used in this analysis can be found within the Wattfeed dashboard.