Between January and July 2026, India's Southern region used 281,809 million units of electricity, 8.6% more than the same seven months of 2025. The Northern region managed 4.2%.
Stretch that to two years and the gap gets embarrassing. Southern demand has compounded at 5.2% a year since 2024. Northern has compounded at 1.3%.
Which would be a tidy story, except that if you watched the grid day by day you would never spot it. The North and West still run the place.
Who runs the day
On any given day, the largest block of energy demand in India sits in the Western region: Maharashtra, Gujarat, Madhya Pradesh, Chhattisgarh. It held that title on 223 days of 2025 and on 141 of the 212 days through July 2026.
Then summer arrives and the North simply takes it.
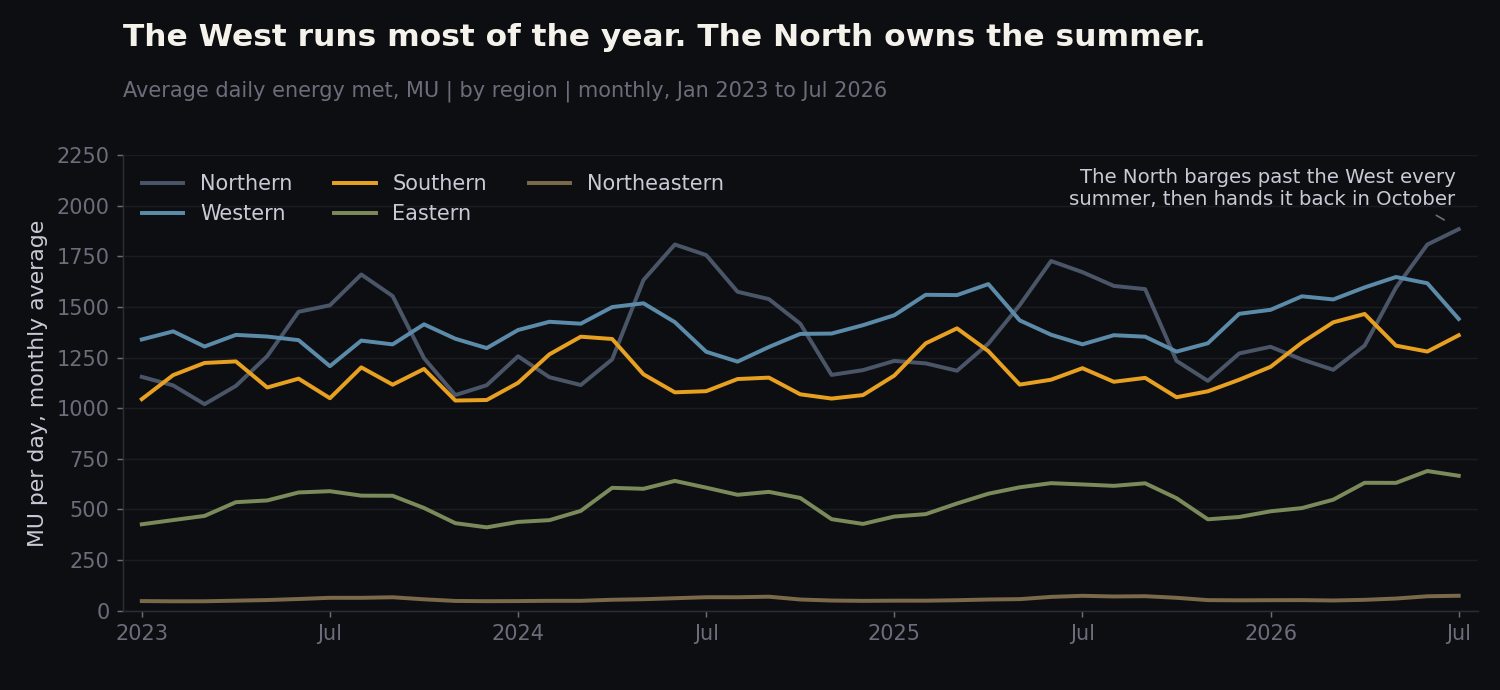 Average daily energy met in MU, by region, monthly. The Northern and Western lines swap places twice a year, every year. Source: Wattfeed dashboard.
The handover is remarkably punctual. Western leads from roughly October through April. Somewhere in May the Northern line crosses over, holds through the monsoon, and gives it back in October. In July 2026 the Northern region averaged 1,885 MU a day, its heaviest month in the eleven years of CEA daily data.
The reason is not mysterious. Western demand is industrial and reasonably flat: Gujarat's chemicals, Maharashtra's manufacturing, Chhattisgarh's metals. That load turns up on a Tuesday in February much as it does on a Tuesday in July. Northern demand is weather. Agricultural pumping, and above all cooling across the Indo-Gangetic plain, which is why the Northern line looks less like a business and more like a temperature chart wearing a disguise.
One nice detail from 2026: the West held on through May, which it doesn't usually manage. Western May averaged 1,648 MU a day, its own record month. The North only took the lead in June.
Growth moved south and east
Run the same seven-month window at state level and the ranking is unambiguous.
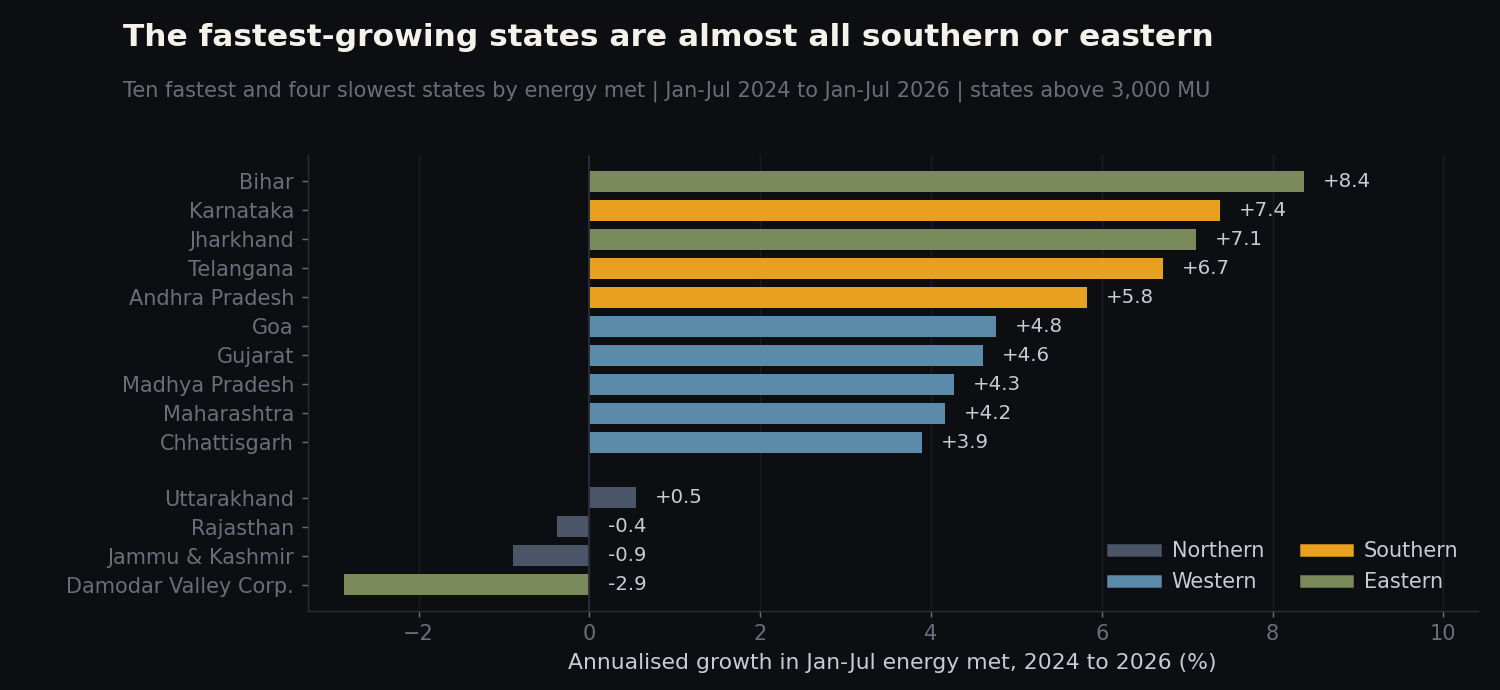 Annualised growth in January-July energy met between 2024 and 2026, for states above 3,000 MU. Ten fastest and four slowest. Source: Wattfeed dashboard.
Bihar leads at 8.4% a year, then Karnataka at 7.4%, Jharkhand at 7.1%, Telangana at 6.7% and Andhra Pradesh at 5.8%. Every one of the top five is southern or eastern. The bottom of the table is almost entirely northern: Rajasthan has actually shrunk slightly, at minus 0.4% a year, and Jammu & Kashmir by 0.9%.
Back in 2015, Southern and Northern demand were within a few percent of each other and the South looked like the smaller, slower sibling. Now the South is at 26.3% of national demand and closing on the North's 29.2%, while growing at four times the rate.
Two different things are going on, and it's worth not conflating them. Bihar and Jharkhand are growing fast off a small base, which is what electrification and rising household connections look like in the numbers. Karnataka, Telangana and Andhra Pradesh are growing fast off a large one, which is data centres, industry and a genuinely warming urban south. The second kind is what moves the national total over a decade.
So on the medium-term question: Southern is the region that matters. It is already the third largest, it is the fastest growing of the three big ones, and its growth is coming from load types that don't switch off in a mild year. The Northern region will still deliver the scariest summer numbers, because that's what a heat-driven system does. It just won't deliver the growth.
Peak is outrunning energy
Here is where the clean story gets complicated.
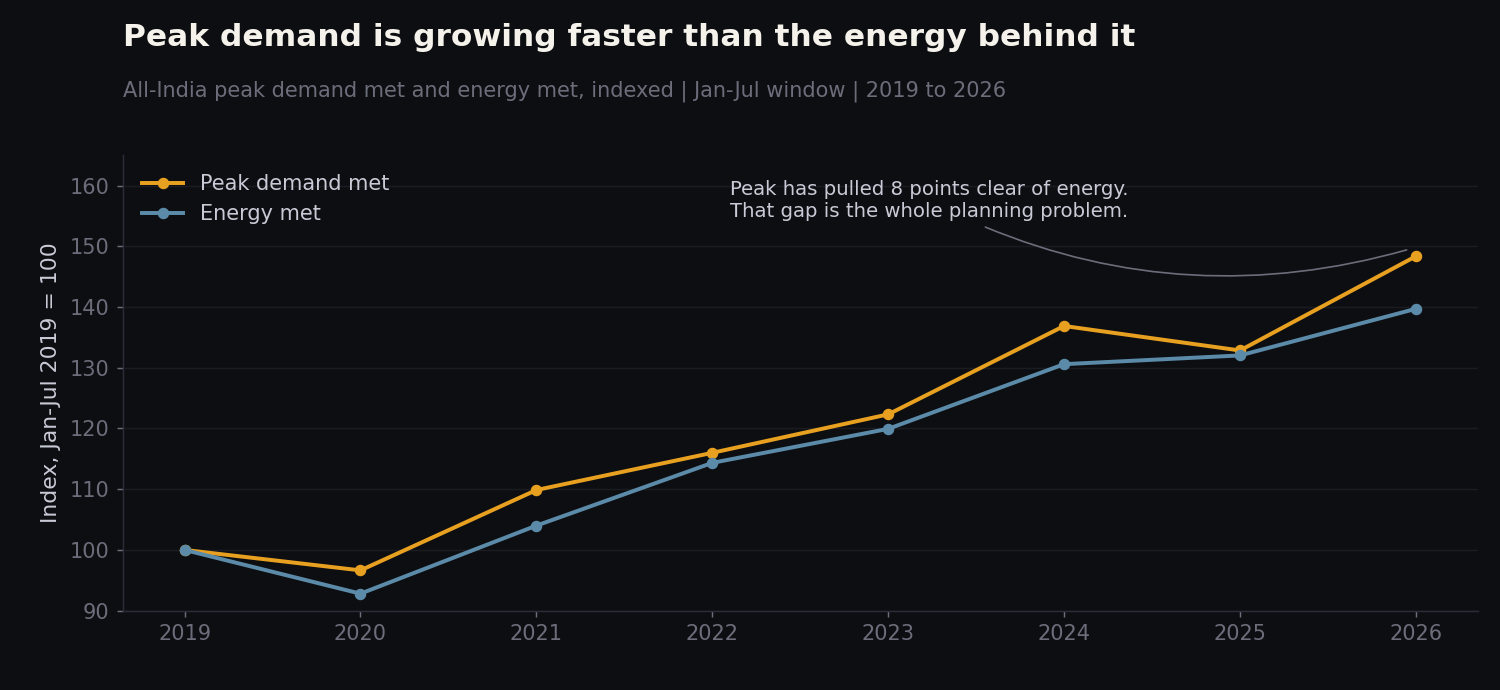 All-India peak demand met and energy met, both indexed to the January-July 2019 level. Source: Wattfeed dashboard.
All-India energy met grew 5.8% in the January to July window of 2026. All-India peak demand met grew 11.7%, to 270,820 MW. Peak has now pulled about eight index points clear of energy since 2019.
The regional split of peak growth says the same thing as the energy split, only louder. Summing daily state peaks, the Southern region's grew 10.2% year on year in 2026 and the Eastern region's 8.2%, against 3.5% for the Northern.
A caveat on that figure: adding up state peaks is not the same as a regional peak, because states don't all peak at the same moment. It's a fair measure of direction and a poor measure of level, and it is used here only for the first.
The sagging load factor
Load factor is the ratio of energy actually used to the energy you'd have used if demand sat at its peak all month. High means a flat, efficient, well-utilised system. Low means you're building capacity that spends most of its life waiting.
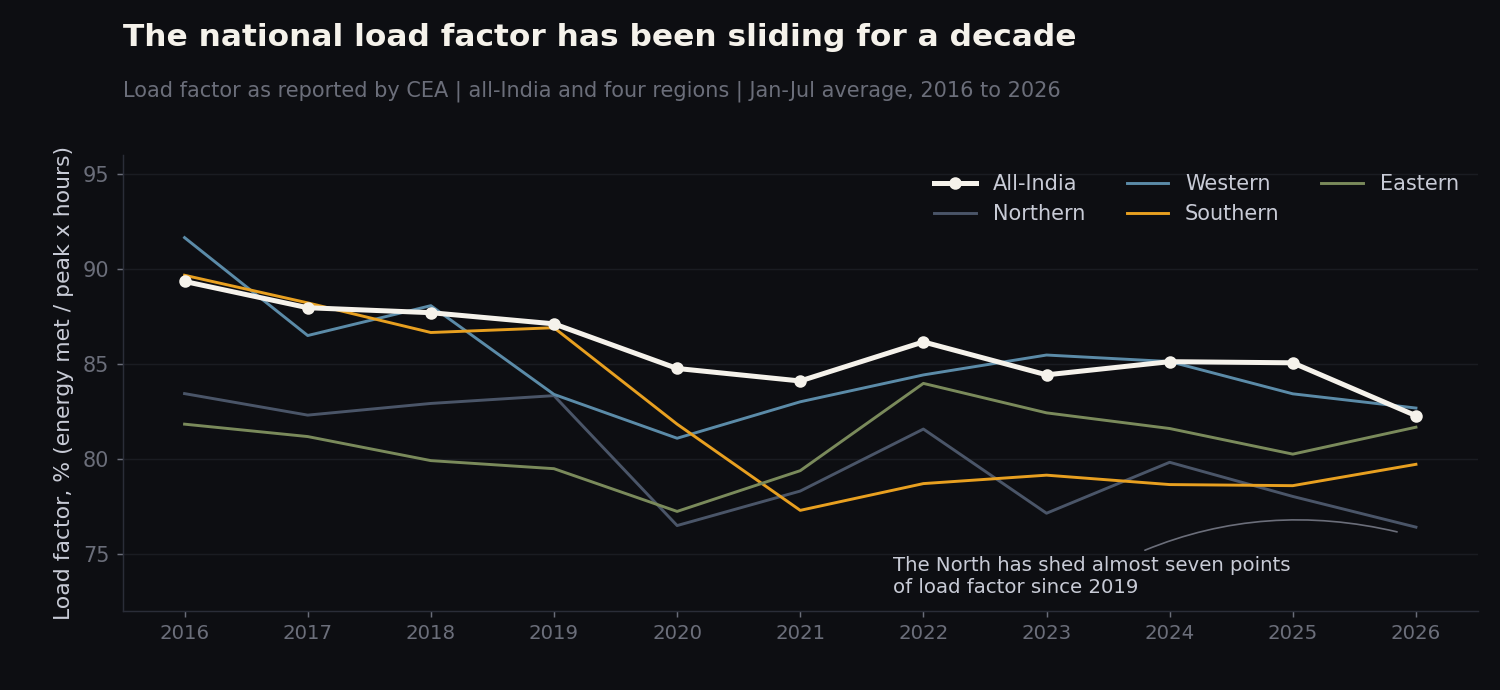 Load factor as reported by CEA, all-India and four regions, averaged across January to July. Source: Wattfeed dashboard.
All-India load factor for January to July 2026 came in at 82.3%. That is the lowest reading in this series, which starts in 2013, and it is nearly seven points below the 89.3% of 2016.
The Northern region is where most of that has gone. It ran at 83.3% in 2019 and 76.4% in 2026. A region that adds air conditioners faster than it adds anything else will do exactly that: the peak climbs, the average doesn't keep up, and the ratio slides.
The South, quietly, is the only region moving the other way. Southern load factor bottomed at 77.3% in 2021 and has crept up to 79.7%. Growing demand that is partly industrial and partly round-the-clock digital load turns out to be much better-behaved than growing demand that is entirely about staying cool in May.
What happens next
Southern demand should pass the Northern region's share of the national total within about three years. The gap is 2.9 percentage points and has been closing at roughly a point a year. That assumes the North keeps growing near 1 to 2%, which is a bigger assumption than it sounds, since one brutal summer could close the gap on its own from the other direction.
Expect the all-India load factor to keep sliding, probably into the high seventies by the end of the decade. It has fallen in eight of the last ten Januarys-to-Julys. Nothing in the demand mix is currently pushing the other way at national scale.
Bihar will keep leading the growth table for another two or three years, then slow. It is growing at 8.4% a year off a base of about 30,000 MU per seven months. Growth rates like that are a function of a low base, and low bases don't stay low.
Watch Karnataka rather than Bihar for the number that actually matters. It added roughly 8,800 MU to its January-July total in two years, the second-largest absolute addition of any state after Maharashtra, and it is doing so at 7.4% a year. If that holds through 2028 it changes the Southern transmission and generation picture, not just Karnataka's.
The peak-versus-energy gap will widen before it narrows, assuming the last three summers are any guide. That's an argument for flexibility rather than more baseload, though the grid has embarrassed forecasters with less provocation than this.
The West still runs India's grid every morning, and the North still owns every June. But the money is being spent somewhere south of both of them, and the numbers have been saying so for about three years now.
All data used in this analysis can be found within the Wattfeed dashboard.